PMBA6093 · Analytics for Managers · Final project REVISED ANALYSIS · 26 SEP 2026
When nature calls, where should New York answer?
New York has committed to 2,120 public restrooms by 2035 and lists 975 today. We estimate demand from the factors Local Law 58 names, weighted by what the City's first 17 pilot sites have in common, and subtract the restrooms actually open. The access shortage is mostly in the evening, and much of it can be met by keeping existing restrooms open or repairing them, though that adds nothing to the law's count. For the count, reaching every resident takes about 830 new restrooms in our scenario, with steep diminishing returns: about 300 reach 95% of residents.
Walkthrough
The answer: open about 155 existing restrooms in the evening (longer hours or repair), build 24 new units in the busiest areas, then grow toward the law's count in order of residents reached.
- Question. The law requires 2,120 public restrooms by 2035; 975 are listed. Where is access missing, and what fixes it?
- Demand. The law's factors, weighted by what the City's 17 pilot sites share: mostly busyness.
- Supply. A working restroom open within 500 m: 70% of candidate sites at 2pm, 16% at 9pm.
- Gap. 1,246 of the busiest third have nothing open within 500 m at 9pm; almost all have one by day.
- Close it. 155 existing restrooms (105 park, 34 other operators, 16 repaired, all open to 10pm) cover 95%, if feasible; 24 new units the rest.
- Scale. About 830 new restrooms reach every resident in our scenario: roughly three-quarters of the 1,145 the law requires.
- Does it hold? Across 200 random weightings, new units stay in the dozens (16–38). Actual park hours decide whether 155 existing restrooms need action, or 37.
Tags: In class · S6 course technique (S = session) · Beyond class technique outside the course · From a source fact looked up, not calculated.
1 — The question
- Target: Local Law 58 (2025) requires at least 2,120 public restrooms by 2035, at least half publicly owned. The register lists 975, so 1,145 more are needed. From a source
- What the law leaves open: where they go, and whether a place lacks a restroom or has one that is closed or broken.
- Our question: where is access missing, and does each place need a new restroom or an existing one kept open or repaired?
- Approach: demand minus supply = gap; close it with existing restrooms first, then new units.
2 — What the law says makes an area underserved
An area is underserved when it has insufficient access "because of a lack of public bathrooms or limited opening hours of existing public bathrooms, relative to localized needs", considering "population density, estimated daily foot traffic, public transportation routes, distance to existing public bathrooms by walking or using a mobility device, land use including current commercial and tourist corridors, and equity concerns".
Read the law (intro.nyc) · Link to this step
| Side | Factor in the law | How we measure it at a site | Data |
|---|---|---|---|
| Demand | Population density | Residents within 500 m | Census ACS 2020–24 |
| Daily foot traffic | Modelled pedestrian demand on streets within 250 m¹ | DOT pedestrian demand (Sep 2026) | |
| Public transportation | Subway entries within 500 m | MTA 2025 | |
| Commercial and tourist land use | Jobs within 500 m | Census LEHD 2023 | |
| Equity | Poverty rate of the census tract (a Census area of about 4,000 people) | Census ACS 2020–24 | |
| Supply | Distance to existing restrooms | Distance to the nearest listed restroom open at 2pm, and at 9pm | NYC register (Jun 2025), posted hours |
| Limited opening hours |
- ¹ Each street weighted by length and DOT demand level (1 = lowest, 5 = citywide destination). 500 m ≈ a 7-minute walk.
- The law gives no weights, and none are published. Steps 4–6 estimate them.
3 — Candidate sites: where a restroom could go
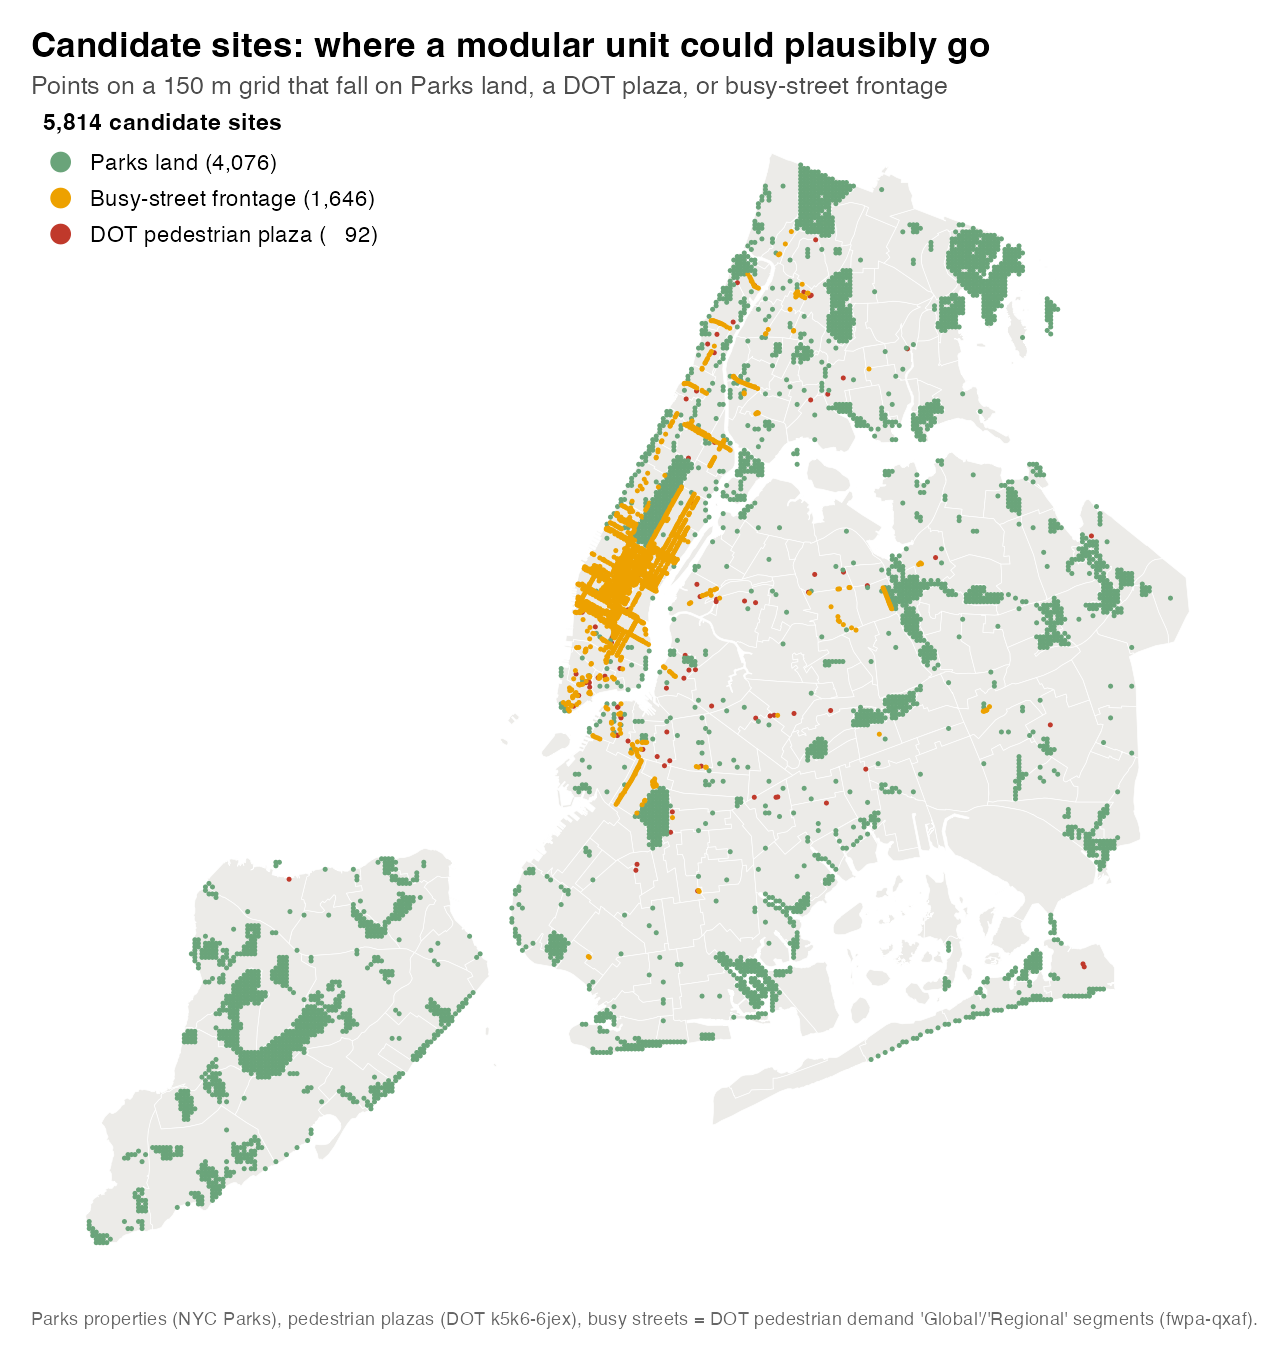
- A 150 m grid over the city, kept where a modular unit could plausibly go: Parks land 4,076 points; busy-street frontage (DOT's highest pedestrian-demand streets) 1,646; DOT plazas 92.
- 5,814 candidate sites. Every factor in step 2 is measured at each.
- Used twice: as the places the City could have picked for its pilot (steps 4–6), and as the places we score and where new units can go (steps 7–10).
- Plausible locations, not approved sites: none checked for space, utilities or permits.
4 — The City's first 17 sites
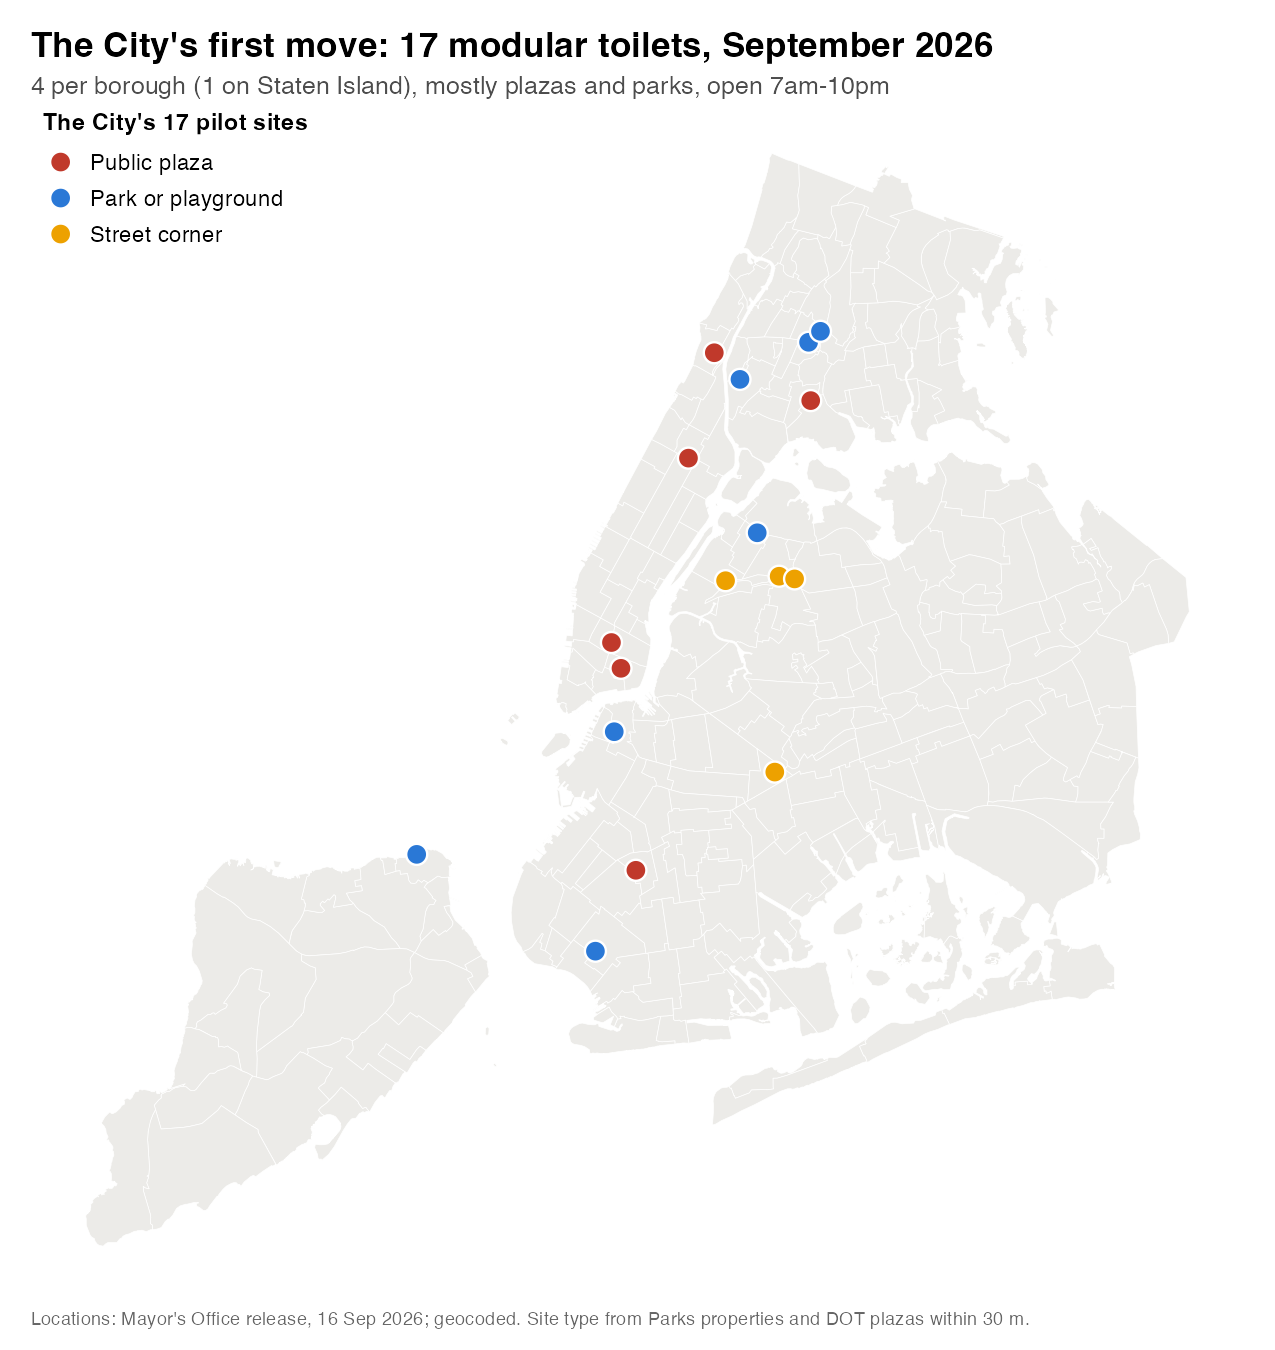
- 16 September 2026: the City began installing 17 modular units; $4M for one year, open 7am–10pm, sited by DOT and Parks with NYCEDC. From a source
- Stated aim: "public plazas and high-traffic areas where New Yorkers currently lack reliable access to a bathroom."
- 4 each in the Bronx, Brooklyn, Manhattan and Queens; 1 on Staten Island. 6 plazas, 7 parks or playgrounds, 4 street corners.
- The City's only siting decisions so far, so we use them as a reference for how it weighs the factors.
5 — What the pilot sites have in common S6–7 · logistic regression
- Comparison: the 17 pilot sites vs the 5,756 candidate sites more than 300 m from any of them.
- Model: logistic regression, picked (1) or not (0). Firth's correction for the small number of picks. Beyond class · Firth correction
- Busyness index: population, foot traffic, transit and jobs move together (correlations 0.52–0.81), so they are logged, standardised and averaged into one measure.
- Controls: distance to a restroom open at 2pm and at 9pm (supply), and site type (park, plaza, street).
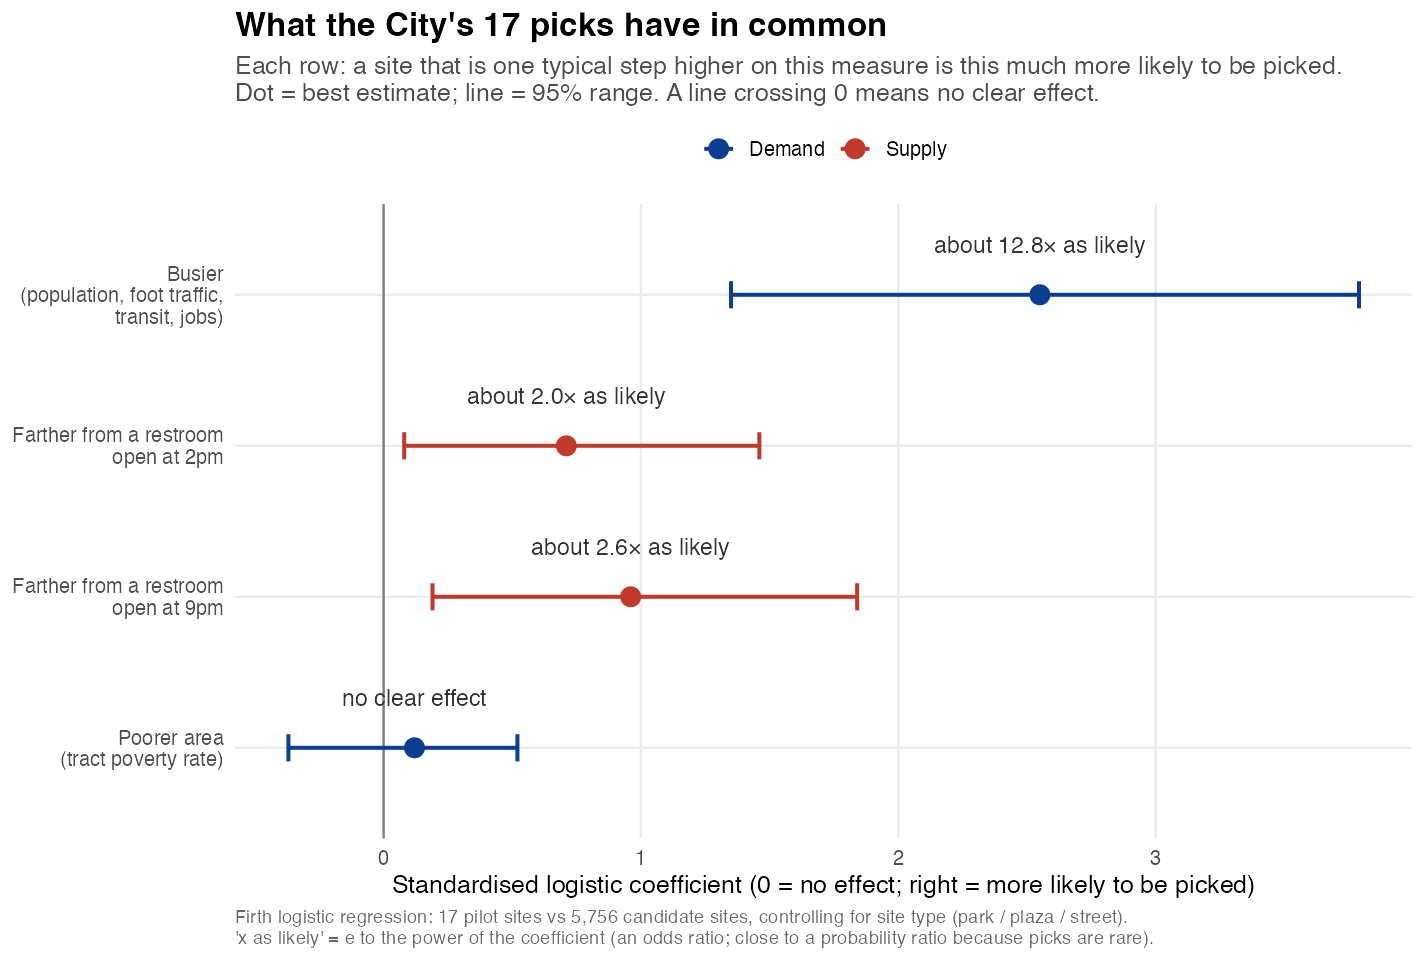
| A site that is… | Side | Coefficient (95% CI) | …is roughly this much more likely to be picked |
|---|---|---|---|
| busier (population, foot traffic, transit, jobs) | Demand | +2.55 (1.35 to 3.79) | 13× |
| in a poorer area (tract poverty) | Demand | +0.12 (−0.37 to 0.52) | no clear effect |
| farther from a restroom open at 2pm | Supply | +0.71 (0.08 to 1.46) | 2× |
| farther from a restroom open at 9pm | Supply | +0.96 (0.19 to 1.84) | 2.6× |
| a plaza rather than park land | Site type | +1.61 (0.23 to 3.04) | 5× |
| a street corner rather than park land | Site type | −2.13 (−3.90 to −0.31) | 8× less |
- Reading the table: two sites alike except one measure, one standard deviation apart (or plaza vs park). Multiplier = ecoefficient (Excel
=EXP(2.55)≈ 12.8), an odds ratio; with rare picks it reads as "times as likely". - From a tiny base: 17 of about 5,770 sites were picked (0.3%). An average park site has a 0.15% chance; one step busier, 1.8%; two steps, 19%. The model ranks kinds of places; it does not name corners.
- Demand weights: busyness 95%, equity 5% (each term's share of the two coefficients). Equity is kept because the law names it; its interval crosses zero.
- Supply: pilot sites sit farther from an open restroom, especially in the evening. Supply is subtracted in steps 8–9, not weighted into demand.
- Caveat: the model shows what the 17 sites share. Space, permits and local requests probably shaped them too.
- Other checks: with the four busyness measures entered separately, population leads (+3.82) and distance stays positive (+1.12 at 2pm, +0.65 at 9pm). Public-urination complaints add nothing (−0.37, 95% CI −1.58 to 0.73); see Limits.
6 — Does the model hold up? S7 · train/test
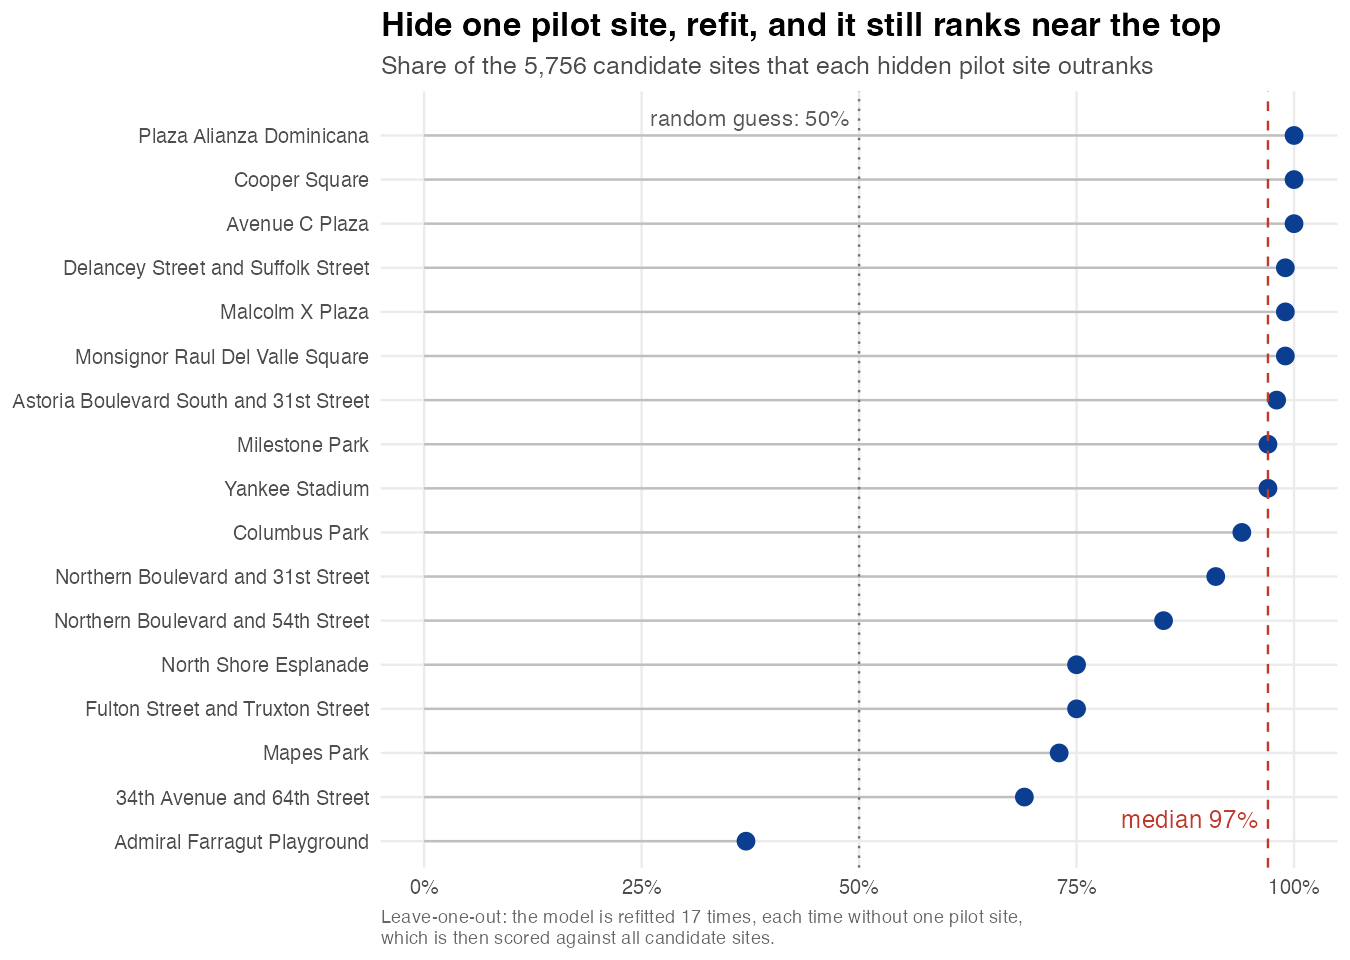
- Leave-one-out: refit 17 times, each time hiding one pilot site, then ask what share of the 5,756 candidates it outranks. 50% = random guess; 100% = beats every candidate.
- Result: the typical hidden site outranks 97% (median; mean 88%). 12 of 17 outrank at least 85%.
- Weakest: Admiral Farragut Playground (37%); then 34th Ave & 64th St, Mapes Park, Fulton & Truxton St and the North Shore Esplanade (69–75%).
- In-sample AUC 0.91; the held-out ranking is the fairer test.
7 — Demand across the city
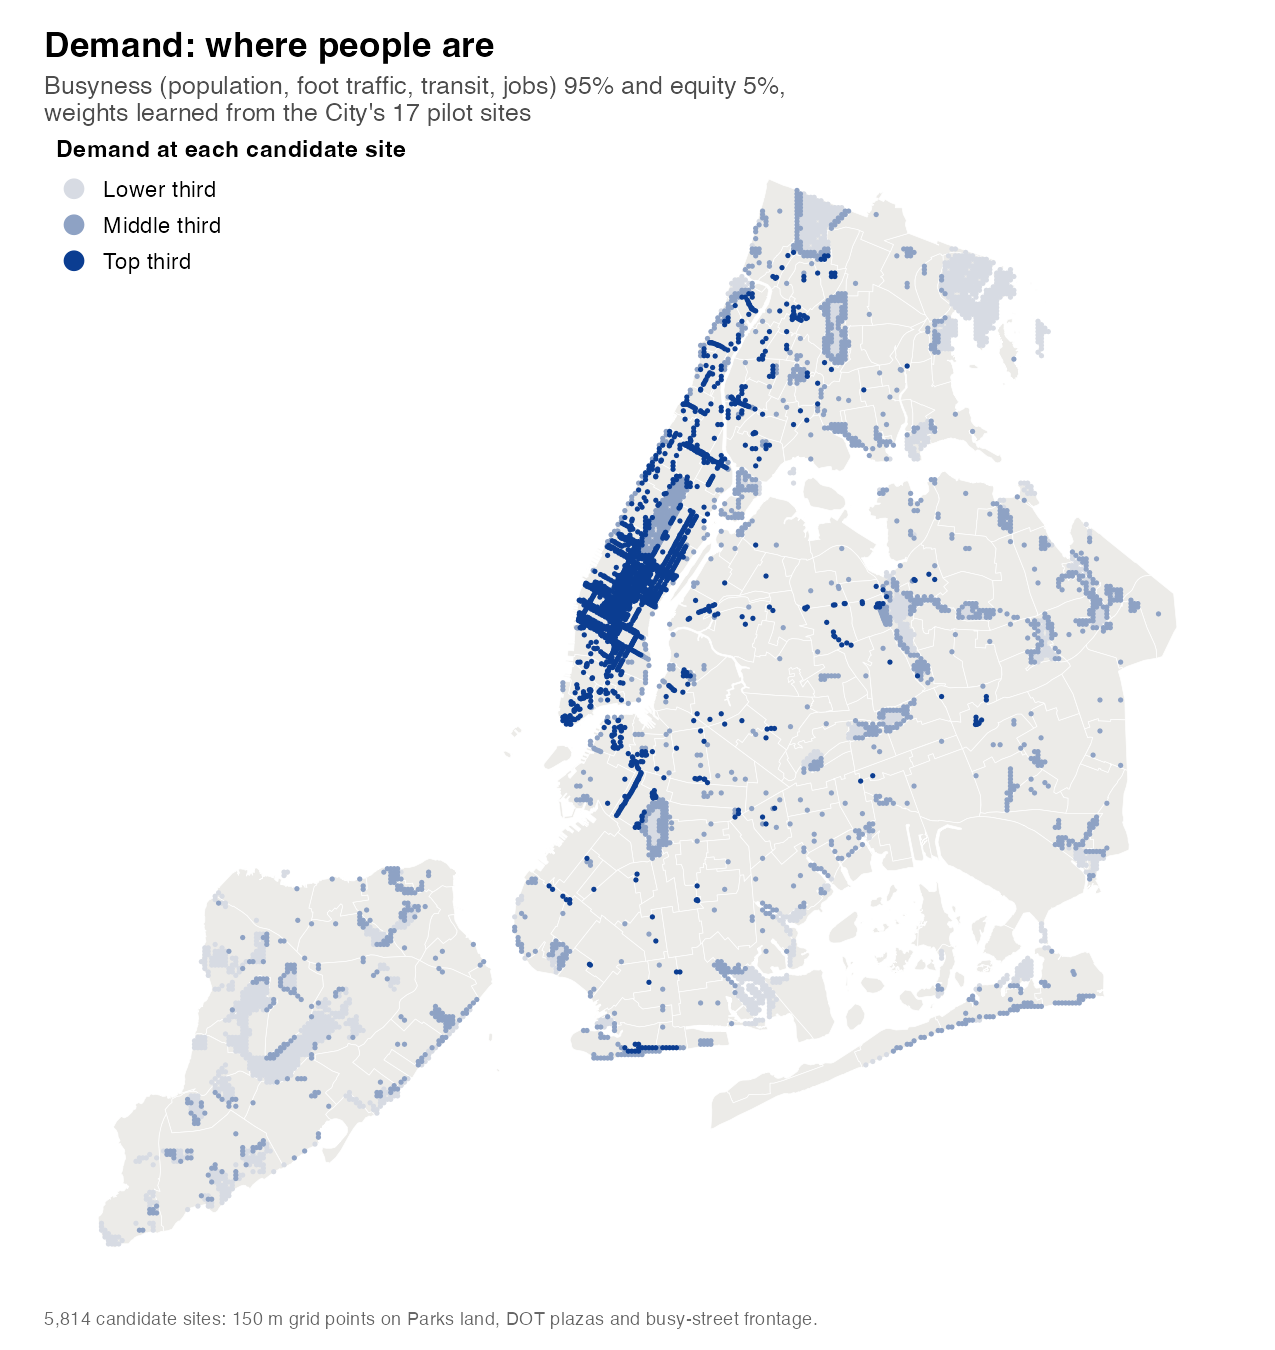
- Demand score = 95% busyness + 5% equity, for all 5,814 sites, ranked 0–100.
- High demand = top third. It holds 14 of the 17 pilot sites: a consistency check, not independent evidence, since the weights come from the same sites.
- Mostly Manhattan: 1,570 of 1,939. Brooklyn 186, the Bronx 111, Queens 72, Staten Island none.
8 — Supply: existing restrooms, when they are open and whether they work
When they are open.
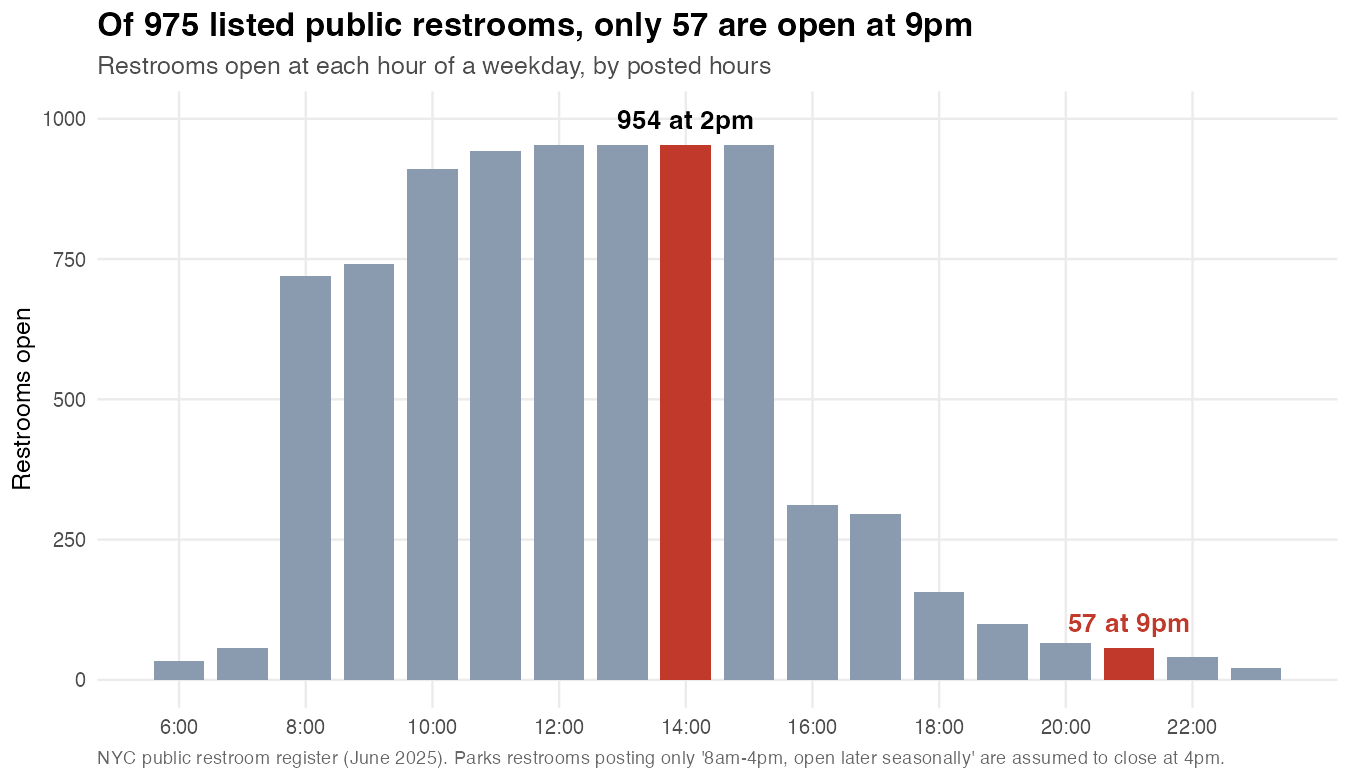
- By posted hours, 954 of 975 listed restrooms are open at 2pm on a weekday; 57 at 9pm.
- 641 Parks restrooms post only "8am–4pm, open later seasonally"; we use 4pm. Step 12 tests 10pm.
Whether they work.
- Parks inspections, January–June 2026: one in five inspections (20.1%) found the restroom unacceptable. From a source
- Listed but not working: 34 closed long-term, 47 failing repeatedly (at least half their inspections since January 2025, and at least twice). Another 41 are closed and unlisted: 122 in all.
- The 81 listed ones are removed from supply, leaving 873 working at 2pm. All 122 are repair candidates in step 10.
What that leaves: a working restroom open within 500 m.
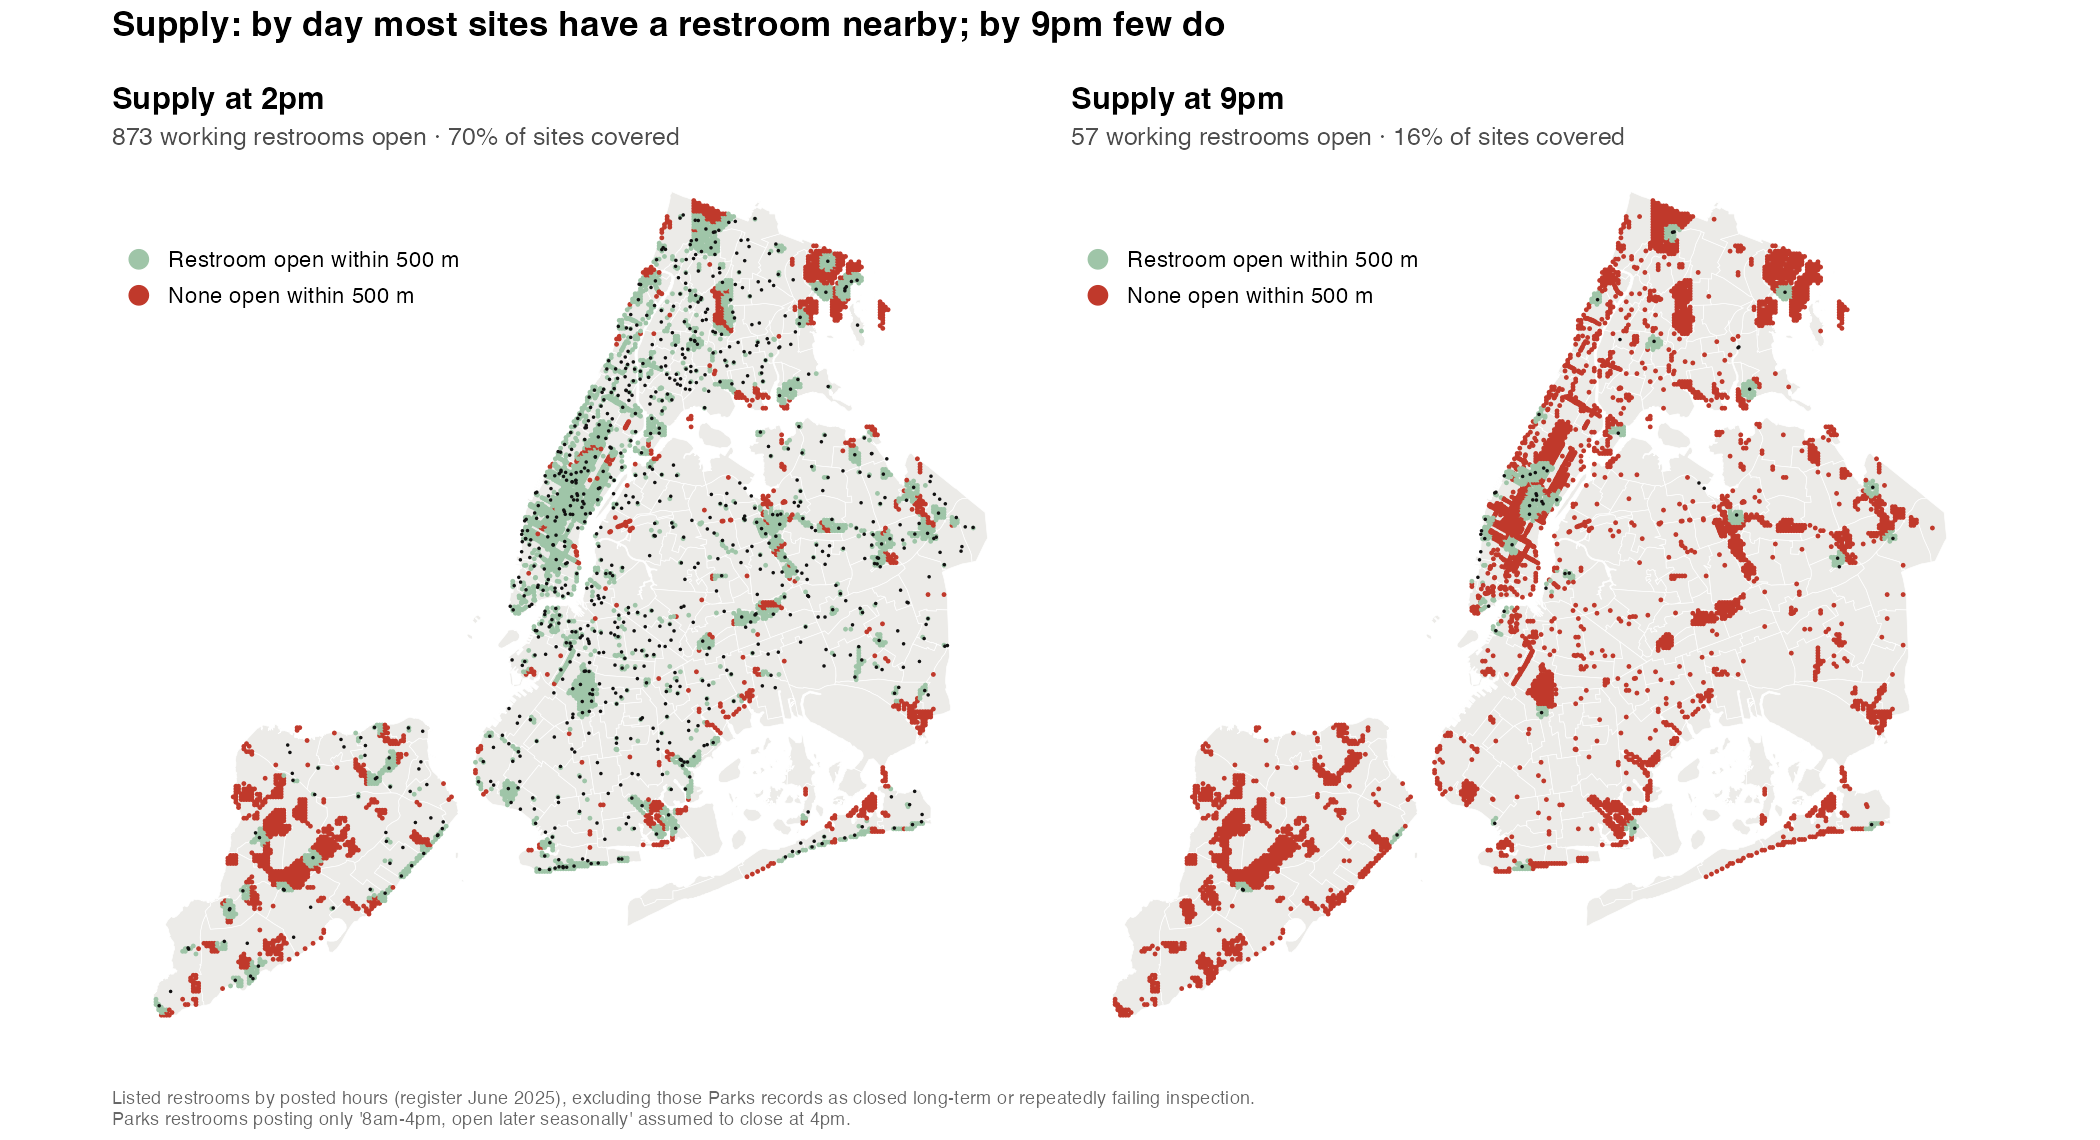
| Already had a working restroom open within 500 m… | All 5,814 candidate sites | The 17 places the City chose for pilot units |
|---|---|---|
| at 2pm | 70% | 13 of 17 |
| at 9pm | 16% | 1 of 17 |
Right-hand column: what was already around the 17 pilot locations, not counting the units themselves.
- The City's pilot sites had restrooms nearby by day but almost none at night, and the units stay open to 10pm: an evening shortage. So supply is measured at 9pm.
9 — The gap: demand minus supply
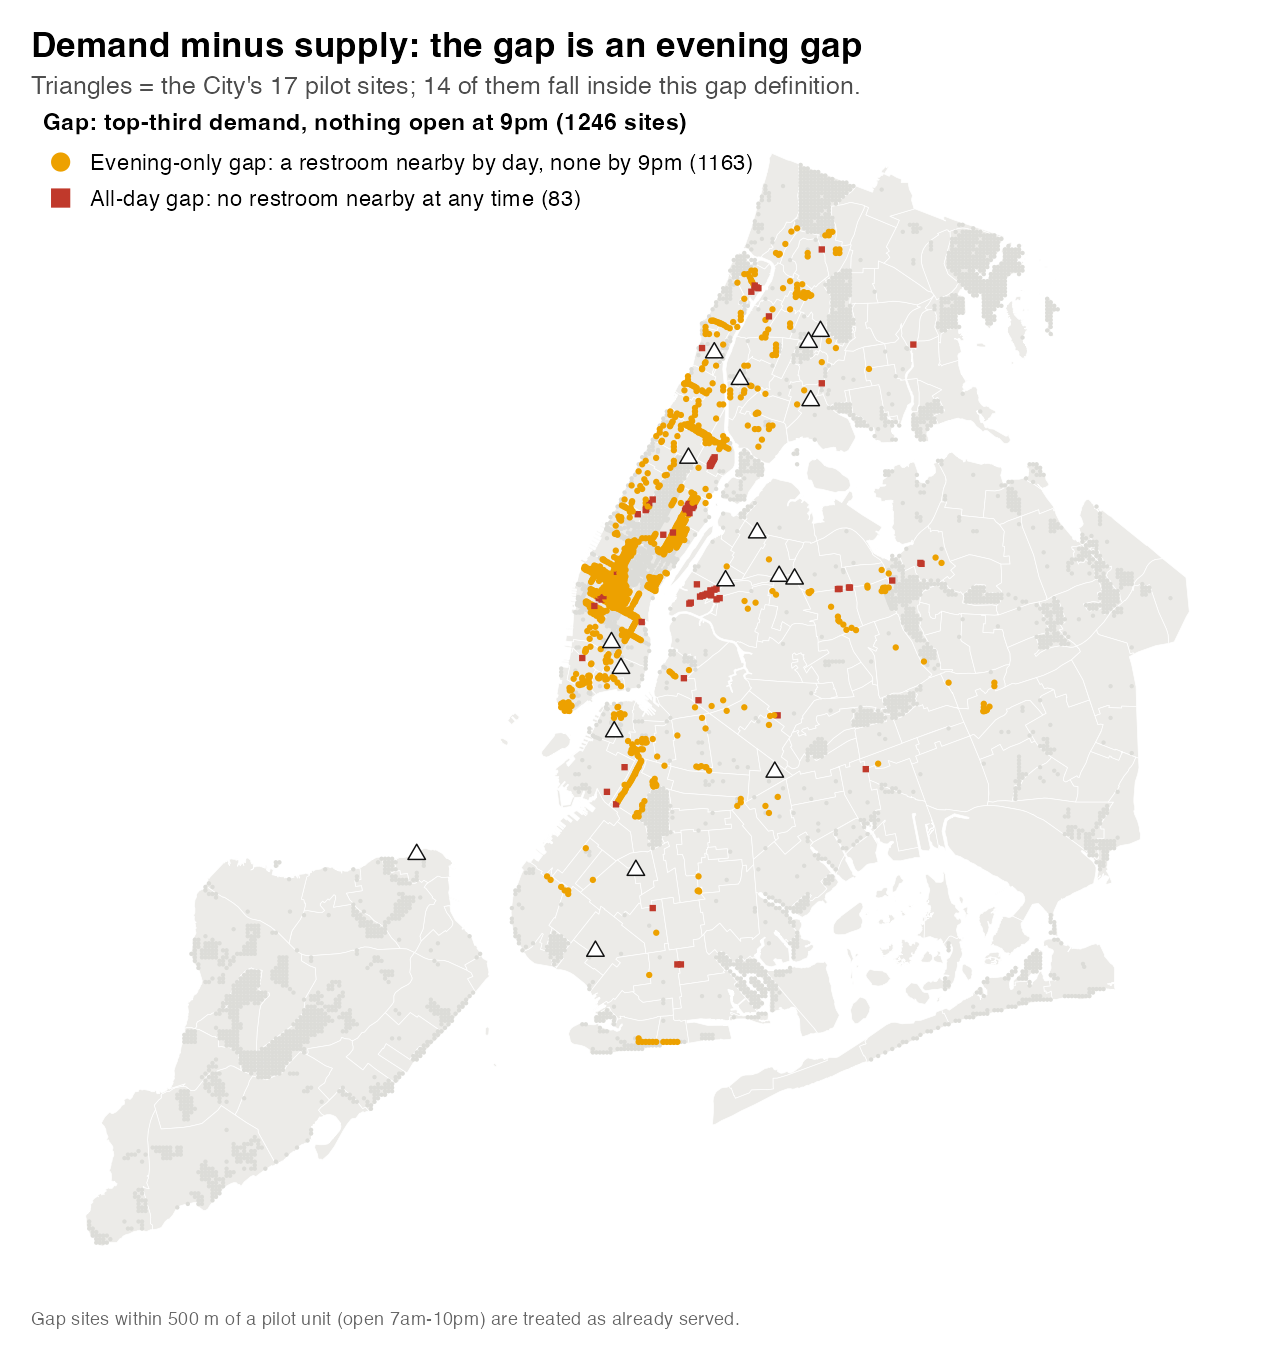
- Gap site = top-third demand and no restroom open within 500 m at 9pm. Pilot units count as supply, assuming all 17 operate 7am–10pm (installation began 16 September); step 12 tests the opposite.
- 1,246 gap sites (21% of candidates): 1,163 evening-only (restroom nearby by day, none by 9pm) and 83 all-day (none at any time).
- Consistency check: before the pilot units count as supply, 14 of the 17 pilot sites meet this definition, against 23% of candidates.
- Gap sites are points, not people; step 11 counts residents.
10 — Closing the gap in the busiest areas: existing restrooms first, then new units Beyond class · maximal covering
- Method: greedy maximal covering (Church & ReVelle 1974): add one restroom at a time, whichever covers the most remaining demand-weighted gap within 500 m. A workable set, not a proven minimum.
- Stage 1, existing restrooms at their own locations: keep a daytime one open to 10pm (the pilot's closing time), or repair a broken one and keep it open to 10pm.
- Stage 2, new units at candidate sites, only where nothing existing reaches.
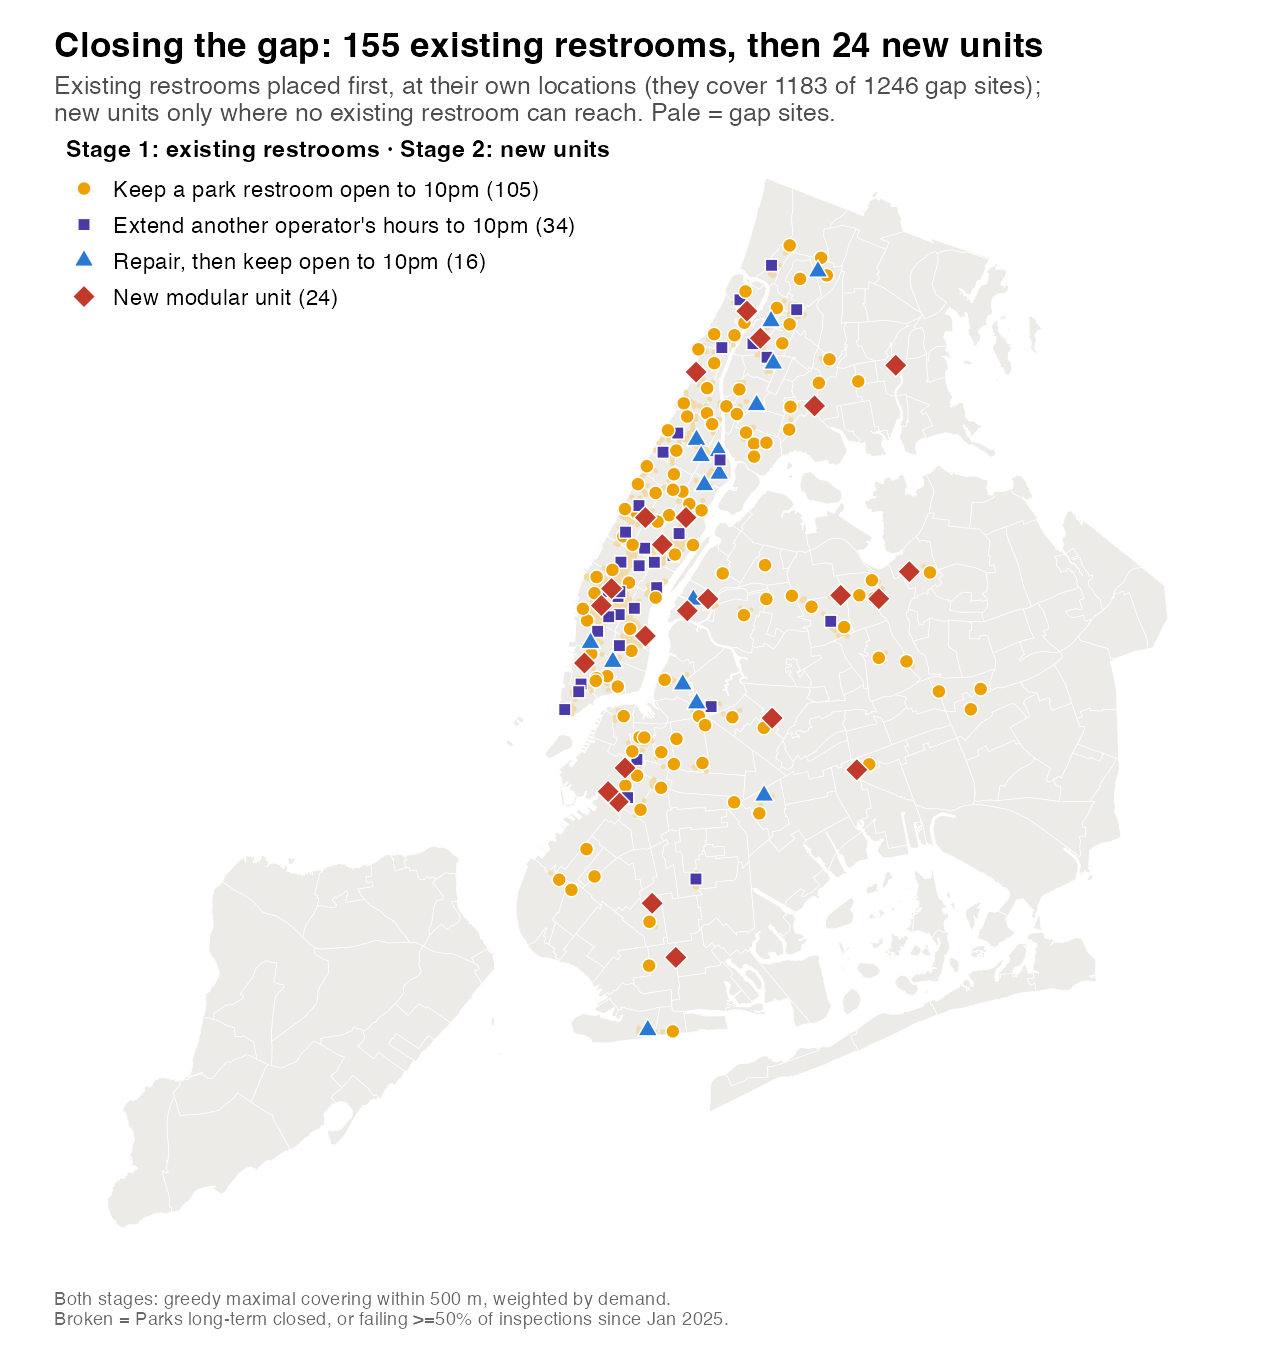
| Stage | Action | Restrooms |
|---|---|---|
| 1 · Existing | Keep a park restroom open to 10pm | 105 |
| Extend another operator's hours to 10pm, mostly public libraries (NYPL 20, Brooklyn Public Library 4) | 34 | |
| Repair or reopen, then keep open to 10pm | 16 | |
| 2 · New | Build a modular unit | 24 |
- Stage 1 covers 1,183 of the 1,246 gap sites (95%); the 24 new units cover the other 63. Together: every gap site within 500 m.
- If feasible: each of the 155 still needs its actual hours, operator agreement, access, repair scope and cost checked.
- By borough: existing in Manhattan 75, Brooklyn 34, the Bronx 27, Queens 19; new in Manhattan 9, Queens 7, Brooklyn 5, the Bronx 3.
- Examples. Longer park hours: Bryant Park, Chelsea Park, Hester St Playground, Riverbank Playground. Repair: St. Nicholas Playground, Marcus Garvey Park, Asser Levy Park. New units: Long Island City, Jackson Heights, Flushing, Park Slope, Chelsea–Hudson Yards.
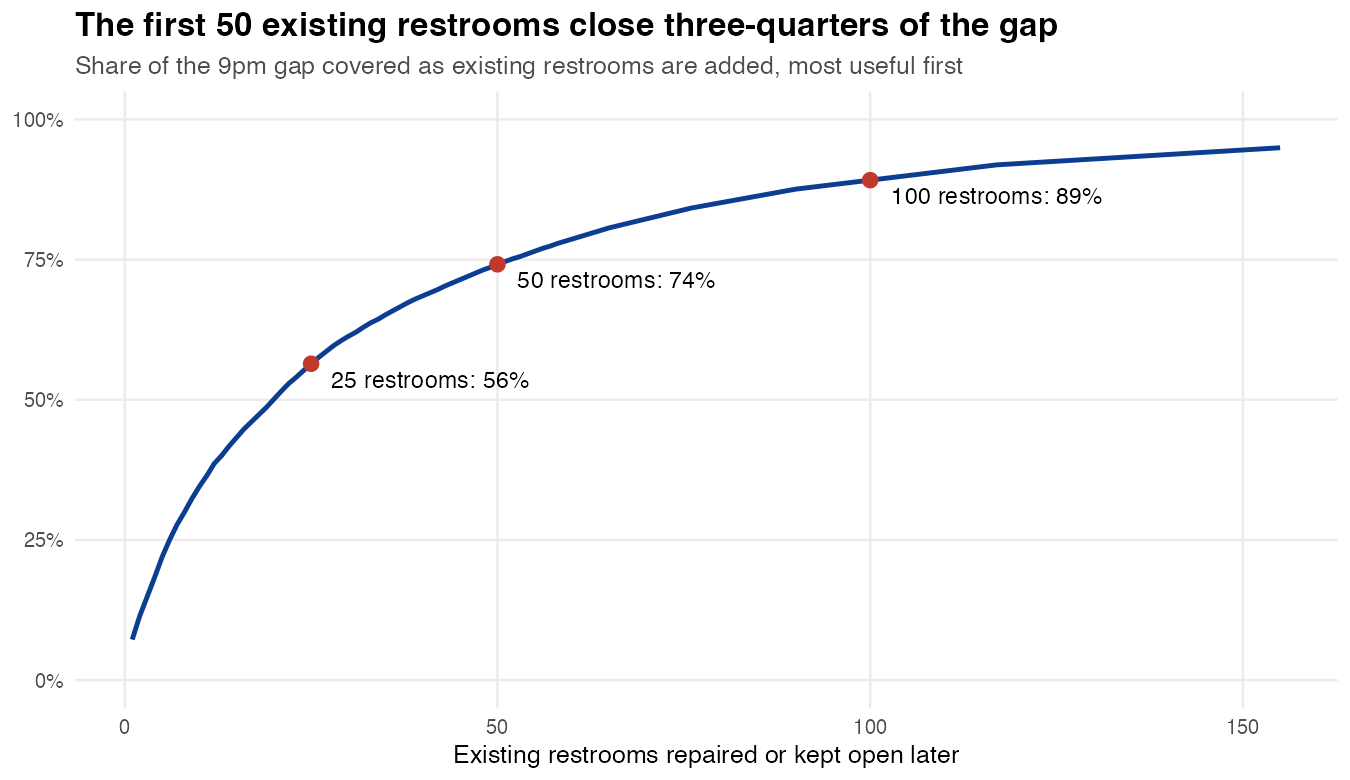
- Most of the gain comes early: the first 25 existing restrooms cover 56% of the gap, 50 cover 74%, 100 cover 89%.
11 — Beyond the busiest third: access for every resident, and the law's count
Whole city, counting residents (Census population on a 150 m grid) instead of candidate sites.
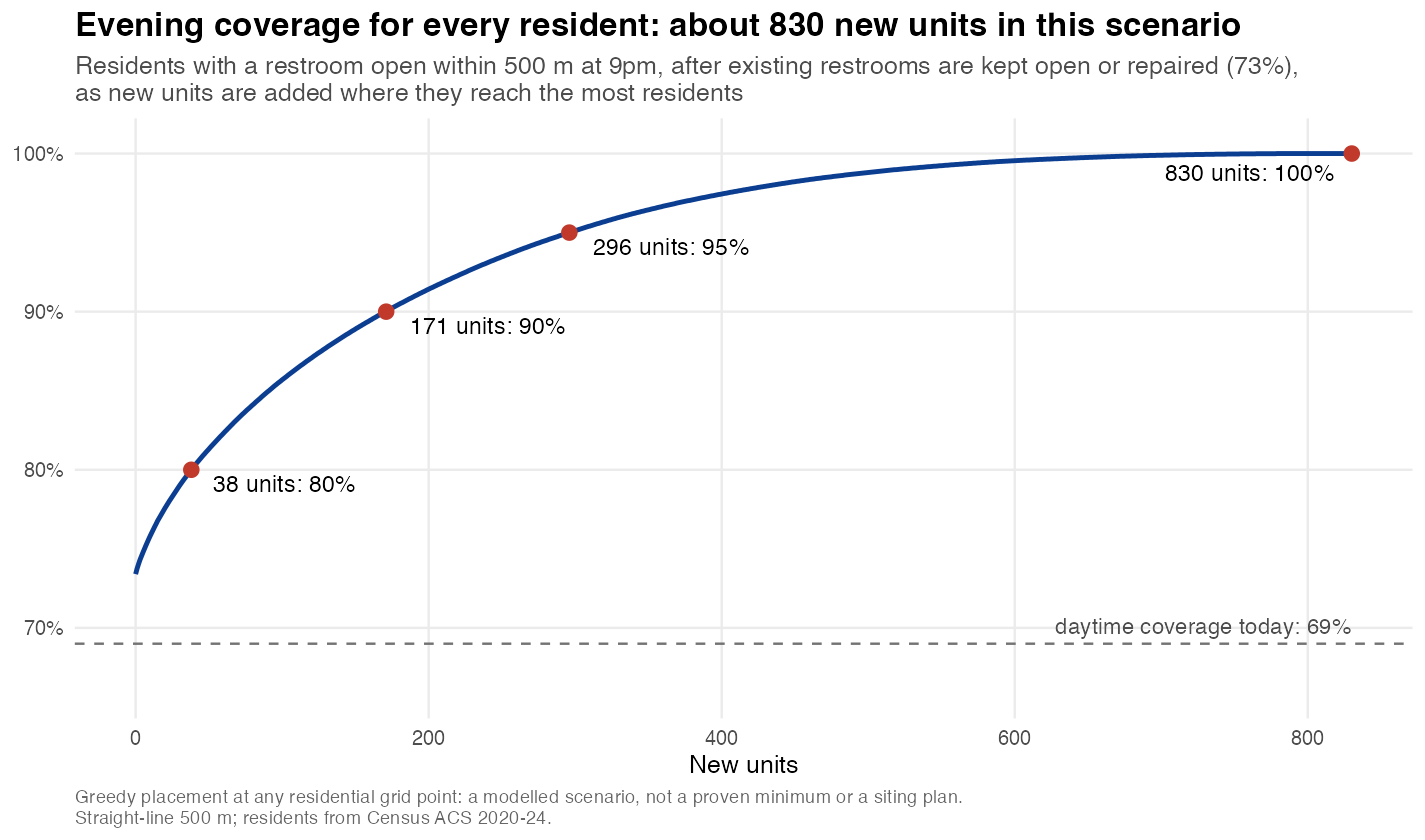
| Residents with a restroom open within 500 m | What it takes |
|---|---|
| Today, 2pm | 69% |
| Today, 9pm | 4% |
| 9pm, existing restrooms kept open to 10pm or repaired | 73%, using 761 existing restrooms and no new units |
| 80% of residents | + 38 new restrooms |
| 90% | + 171 |
| 95% | + 296 |
| 100% | + 830 |
- Access without building: 761 existing restrooms (457 park kept open later, 207 other operators extended, 97 repaired) lift evening access above today's daytime 69%, if the changes are feasible.
- But the count grows only with new restrooms. Every resident takes about 830: roughly three-quarters of the 1,145 required, for a total near 1,805 against 2,120.
- Building the 24 busiest-area units first changes little: 837 in total, including the 24.
- 830 is a modelled scenario, not a minimum. The greedy method may overshoot, but the scenario counts only residents and measures reach, not capacity, so real need is likely higher. The 100% end is sensitive to how residents are spread on the grid.
- Diminishing returns: about 300 new restrooms reach 95%; the last 5% takes about 530 more. At the pilot's cost ($4M for 17 units a year, about $235,000 per unit per year including servicing), that is roughly $125M a year. From a source
12 — Does the answer hold? Stress-testing our assumptions Beyond class · Monte Carlo sensitivity
Tests step 10's answer (155 existing, 24 new). The 830 in step 11 is a scenario with its own caveats.
1. The weights (from only 17 pilot sites)
- Whole analysis rerun 200 times with random weights on the four busyness measures and equity.
- Result: 151–211 existing restrooms (median 180), 16–38 new units (median 27). The base case sits near the optimistic end.
- In every run: the gap is mostly evening, existing restrooms do most of the work, new units number in the dozens.
- No-regret shortlist: 103 of the 155 are chosen in at least 80% of runs. For new units, 13 of 24 areas keep a unit within 500 m in at least 80%.
2. Park hours (the biggest unknown about the facts). We use 4pm, but the register itself ("8am–4pm, open later seasonally") says that is wrong for part of the year.
| Park restrooms with vague hours… | Gap sites | Existing restrooms | New units |
|---|---|---|---|
| close at 4pm (posted hours, base) | 1,246 | 155 | 24 |
| stay open to 10pm | 396 | 37 | 24 |
- If parks already stay open to 10pm, the gap is about a third as large and 37 existing restrooms need action, not 155.
- The 24 new units are unchanged: they go where nothing is within reach.
- So: verify actual hours first. If parks already stay open late, the job is to guarantee and signpost those hours.
3. Walking distance (a standard we chose)
- 500 m (7 minutes): 155 existing, 24 new. 400 m (5 minutes): 192 and 56.
- Same shape; roughly double the new units.
Also tested, little effect: 8pm or 10pm instead of 9pm (150 or 162 existing, 24 new either way); no pilot units open yet (1,357 gap sites, 162 existing, 25 new). How much of the city to cover is a choice, not an uncertainty: see step 13. All combinations are charted in Data & code.
13 — Recommendation
Now: the evening gap in the busiest areas, mostly with restrooms that already exist, if the changes prove feasible.
| Action | Do this | Scale |
|---|---|---|
| A. Verify | Actual park hours; for each of the 155, operator agreement, access, repair scope and cost. Start with the no-regret 103 | 155, or nearer 37 (step 12) |
| B. Open what exists in the evening | Commit to and publish 10pm park hours, matching the pilot; negotiate later hours with libraries and plaza operators | 139 (105 park, 34 other operators) |
| C. Repair or reopen | Restore restrooms that are closed long-term or failing inspection, and keep them open to 10pm | 16 |
| D. Build where nothing exists | New modular units where no existing restroom can reach | 24 |
A cheaper option to test: partner toilets.
- Café and fast-food toilets are not public: Starbucks requires a purchase (since January 2025); McDonald's leaves it to franchisees; NYC gives no general right of use. From a source
- London (about half its boroughs) and about 210 German cities pay businesses to open their toilets, in London roughly £500–£1,200 a year each. NYC has no scheme. From a source
| Scenario (1,854 chain outlets) | Gap sites | Existing restrooms | New units |
|---|---|---|---|
| No partner scheme (base) | 1,246 | 155 | 24 |
| Half of outlets join; late-night fast food counts at 9pm (median of 200 draws) | 451 | 91 | 14 |
| Every outlet joins; late-night fast food counts at 9pm | 266 | 61 | 12 |
- Could replace roughly 10 of the 24 new units, at a fraction of a unit's cost. Outlet hours are not in the data, so these are scenarios.
Later: toward the law's count. How much of the city to cover is the City's choice; each step up costs more.
| Scope | Existing restrooms | New units |
|---|---|---|
| Busiest quarter of candidate sites | 95 | 13 |
| Busiest third (base) | 155 | 24 |
| Busiest half | 344 | 76 |
| Every resident (step 11; counts residents, not candidate sites) | 761 | about 830 |
- E. Build toward the count in order of residents reached (step 11).
- Decide the last stretch separately: is roughly $125M a year better spent on the final ~530 units, each reaching few residents, or on added capacity in the busiest places? The cost of longer hours is unknown; estimate it with Parks.
Throughout.
- Measure as you go S8–9 · A/B test design: roll out in stages, in random order, and compare each wave with areas still waiting, on outcomes: restroom use, public-urination complaints, inspection pass rates.
- Refit with pilot data: usage, uptime and cleanliness are the first direct measure of demand.
Sources and code
- Local Law 58 of 2025: text (intro.nyc)
- Pilot sites: Mayor's Office, 16 Sep 2026; NYCEDC, June 2026
- Data: NYC public restrooms
i7jb-7jku; DOT pedestrian demandfwpa-qxaf; DOT plazask5k6-6jex; Parks properties and inspections; restaurant inspections43nn-pn8j(chain outlets); MTA ridership; Census ACS 2020–24 and LEHD 2023; 311erm2-nwe9 - Maximal covering location model: Church, R. & ReVelle, C. (1974), Papers of the Regional Science Association 32.
- Private toilets: NPR on Starbucks' policy reversal (Jan 2025); YouGov restroom poll (2022); Age UK report on London's Community Toilet Schemes (2022); Bloomberg on Germany's Nette Toilette (2016)
- Every dataset, script and contribution: Data & code tab.
- Code and outputs: GitHub repository. A reviewer guide (CHECKING.md) maps each result on this page to the script that produces it.
Visual guide
The method on one neighbourhood, one step at a time: from an empty map to demand, supply, the gap, and how it is closed. Use the arrows or the numbers; each map can be opened full size for slides.

Limits
What could change the answer, how much, and what would settle it.
What counts as supply
- Park hours. 641 Parks restrooms post only "8am–4pm, open later seasonally" and are treated as closing at 4pm. If they stay open to 10pm, the gap in the busiest third falls from 1,246 to 396 sites and the existing restrooms needed from 155 to 37; the 24 new units are unchanged. Recording actual hours would settle it.
- Partner toilets. The partner-scheme scenarios (step 13) assume outlets are open by day and, for late-night fast food, at 9pm; the data has no opening hours, covers 13 chains only (no hotels, department stores or independents) and includes some outlets inside airports and stadiums. Business toilets are not counted as supply in the base answer because they are not public.
- Broken restrooms. Restrooms Parks records as closed long-term or repeatedly failing inspection are not counted as supply. Treating repeated failure as unusable is an assumption, not a daily observation.
- Pilot units are assumed to be operating 7am–10pm. If none were open yet, the gap would be 1,357 sites, with 162 existing restrooms and 25 new units. Pilot locations are geocoded from the published place names, so their exact points are approximate.
- 18 restrooms with unreadable hours count as closed. Hours are posted, not observed.
After 10pm
- The analysis stops at the evening. Demand is measured by place, not by hour, and the gap is tested at 9pm, inside the pilot's 7am–10pm hours. Late night is not covered.
| 6–10pm | 10pm–midnight | Midnight–6am | |
|---|---|---|---|
| Weekday subway entries (share of the day) | 18.8% | 3.8% | 3.4% |
| Public-urination complaints filed (2020–26) | 23% | 7.1% | 6.9% |
| Working public restrooms open (weekday) | 57 at 9pm | 41 at 10pm, 22 at 11pm | 7 at midnight, 8 at 2am |
- Late night is a smaller but sharper problem. On a weekday, 7.2% of subway entries happen between 10pm and 6am (about 290,000 entries; 11.7% on Saturdays). But 14% of public-urination complaints are filed in those hours (7.1% before midnight, 6.9% after), about twice the late-night share of riders. Working public restrooms fall from 57 at 9pm to 41 at 10pm, 22 at 11pm and 7 at midnight.
- Complaint times are filing times, not incident times; late incidents reported the next morning would make the late-night share higher still.
- The City has not said why the pilot units close at 10pm. Cost, safety and servicing are common reasons elsewhere. A late-night recommendation, such as a few 24-hour units at nightlife and transit hubs, would be a separate question.
The weights
- 17 sites is a small sample. The weights summarise what the first pilot sites share; they are not a measure of need. Across 200 random weightings, 103 of the 155 existing restrooms stay on the list.
- No independent check of need. The pilot sites supply both the weights and the consistency checks (14 of 17 in the top third and in the gap). The complaint check (below) points largely elsewhere. Usage data from the pilot would be the first independent test.
- Equity is uncertain (95% CI −0.37 to 0.52) and carries 5% of demand.
- Validation is limited: the AUC of 0.91 is in-sample. The leave-one-out ranking (median 97%) is the held-out check. Admiral Farragut Playground fits poorly (37%).
- The comparison group includes large park interiors where few people live, which widens the busyness contrast. The site-type control reduces this but does not remove it.
Complaints: a separate check
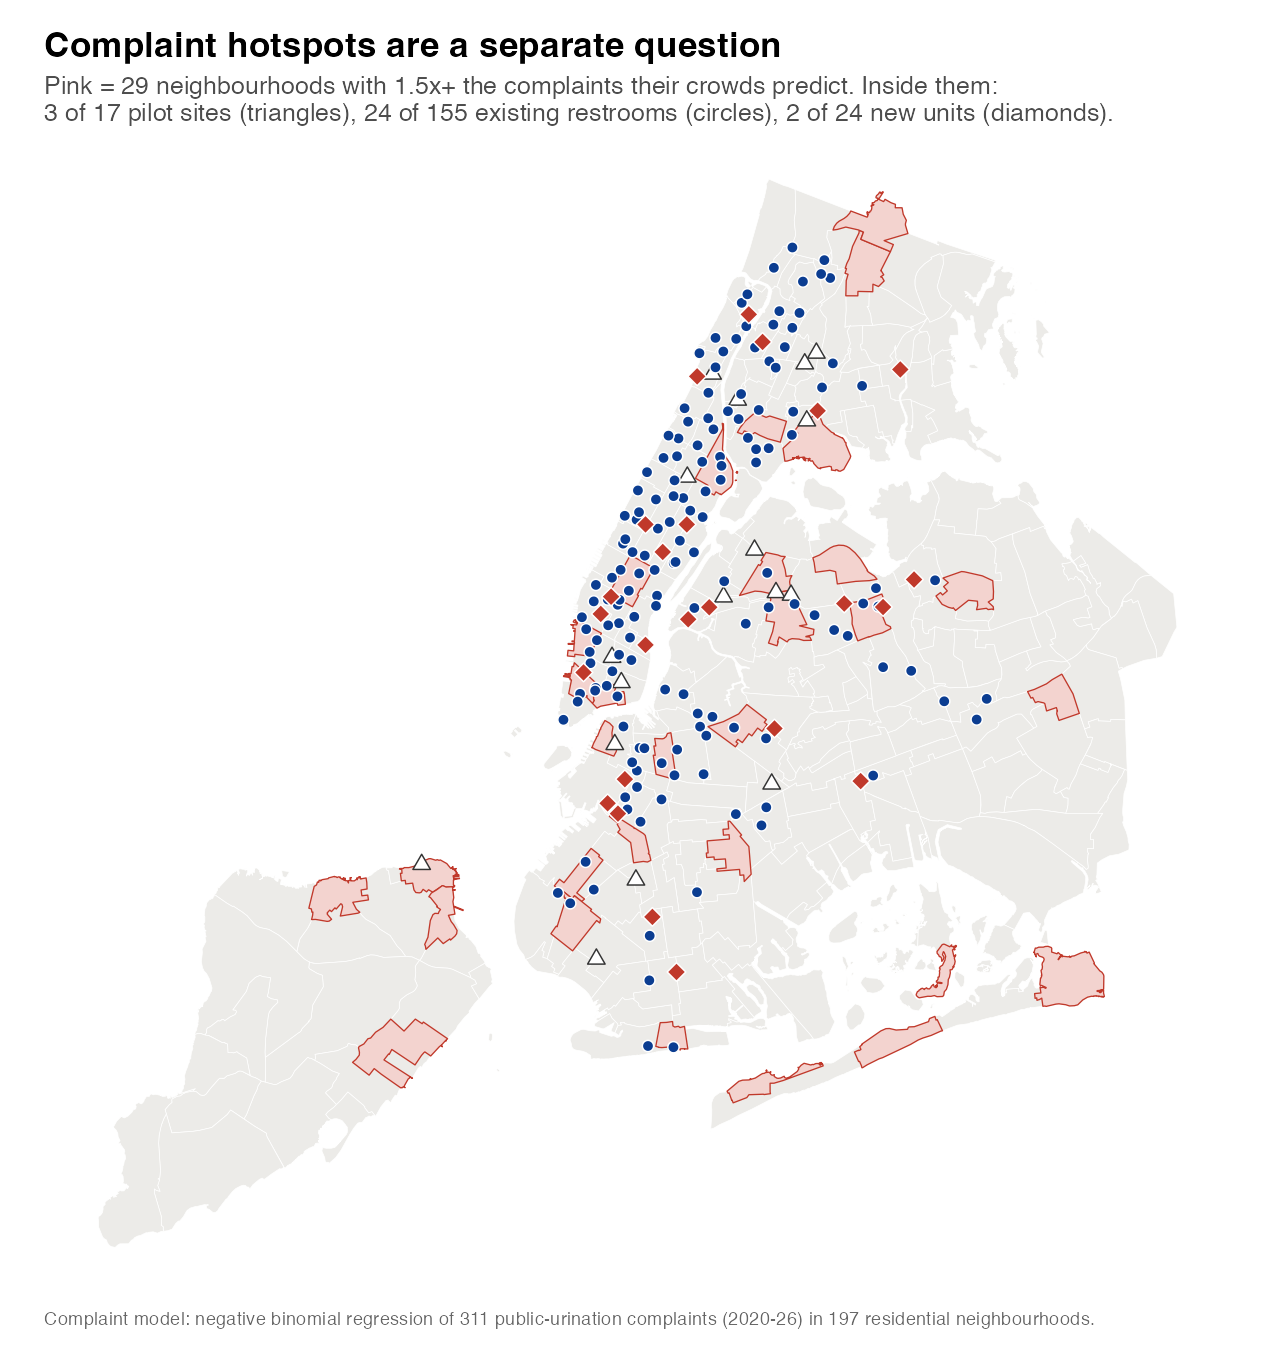
- Why it is here. Complaints are not one of the law's factors, and adding them does not improve the pilot model (step 5). So they are not in the gap or the recommendation. This is the backup answer if asked "why not put restrooms where people complain?"
- Method: we modelled 311 public-urination complaints (2020–26) in each of 197 residential neighbourhoods with a negative binomial regression, a standard model for counts. It predicts each area's expected complaints from its residents, workers, subway riders, hotels, restaurants, income and borough.
- 29 neighbourhoods file at least 1.5 times the complaints their crowds predict. Inside them: 3 of the 17 pilot sites, 24 of the 155 existing restrooms from step 10 and 2 of the 24 new units.
- Reading: complaint hotspots and the law's factors point to largely different places. If the City wants to act on complaints, those 29 areas deserve their own look, starting with repairs (Brighton Beach, Corona, East Harlem) and longer evening hours.
The measures
- Distances are straight-line; real walks are longer.
- Coverage is not capacity. One restroom within 500 m counts as covering everyone nearby, however many people that is.
- Population counts residents; workers enter through jobs. Foot traffic is DOT's model, not counts: DOT's actual counts cover only 114 locations citywide.
The choices we made
- High demand = top third, which contains 14 of the 17 pilot sites. It is the biggest lever on the new-unit count (13 for the top quarter, 76 for the top half).
- Demand is ranked citywide, so high demand is mostly Manhattan (1,570 of 1,939 top-third sites). Ranking within each borough would spread the work more evenly.
- 500 m and 9pm. At 400 m, 192 existing and 56 new; at 8pm or 10pm, the new units are unchanged.
- Coverage method: greedy covering finds a workable set, not a proven minimum. In step 11, new units may go anywhere residents live and only residents are counted, so 830 is a modelled scenario rather than a minimum or a requirement.
- Stability for existing restrooms is exact (the same restroom). For new units it is area-level: a unit within 500 m of the same spot counts as kept.
- Candidate sites are grid points on Parks land, plazas and busy streets. None has been checked for space, utilities, accessibility or approval.
Data timing
- Register June 2025 · inspections to June 2026 · ACS 2020–24 · LEHD 2023 · MTA 2025 · DOT pedestrian demand September 2026 · restaurant inspections September 2026 · pilot list 16 September 2026. Restroom status and hours should be refreshed before acting.
Data & code
Every dataset and script behind the Walkthrough, how to rerun it, and who contributed what.
Datasets
| Dataset | Source | Used for | Walkthrough step |
|---|---|---|---|
| Local Law 58 of 2025 (text) | intro.nyc | The 2,120 target; the definition and factors of an underserved area | 1–2 |
| Modular pilot: 17 sites, hours, cost | Mayor's Office, 16 Sep 2026; NYCEDC | Reference for weighting the factors; the pilot's 7am–10pm hours; $4M cost | 4–6, 11 |
| Public restrooms register | NYC Open Data i7jb-7jku | Supply: location, status, posted hours of 975 restrooms | 8–12 |
| Pedestrian demand (Pedestrian Mobility Plan) | NYC DOT fwpa-qxaf | Foot-traffic factor; busy-street candidate sites | 2–3, 5 |
| Pedestrian plazas | NYC DOT k5k6-6jex | Plaza candidate sites; site type | 3, 5 |
| Parks properties | NYC Parks enfh-gkve | Parks-land candidate sites; site type | 3, 5 |
| Parks Inspection Program: restrooms, sites and inspections | NYC Parks 9byw-znpj, buk3-3qpr, yg3y-7juh, mp8v-wjtf | Broken restrooms: long-term closures, repeated inspection failures | 8, 10 |
| American Community Survey 5-year (2020–24), census tracts | US Census Bureau | Residents (population factor, step 12 coverage); poverty rate (equity) | 2, 5, 11 |
| LEHD Origin-Destination Employment Statistics (2023) | US Census Bureau | Jobs (commercial land use) | 2, 5 |
| Subway ridership by station | MTA ak4z-sape | Transit factor (2025 entries) | 2, 5 |
| Census tracts and Neighborhood Tabulation Areas (2020) | 63ge-mke6, 9nt8-h7nd | Geography: tract poverty, borough and neighbourhood labels | 5, 7, 10 |
| Restaurant inspections (chain outlets) | NYC DOHMH 43nn-pn8j | 1,854 chain outlets as private-toilet supply scenarios | 13 |
| Basemap for the Visual guide | Esri World Light Gray (Esri, HERE, Garmin, OpenStreetMap contributors) | Streets and place names under the step-by-step maps | Visual guide |
| Subway entries by hour of day (2025 averages) | MTA ridership, via the team research package (Steph) | Late-night activity | Limits |
| 311 service requests: "Urinating in Public" | NYC 311 erm2-nwe9 | Complaint check in the pilot model; complaint hotspots | 5, Limits |
| Parks inspection results, January–June 2026 | Parks Inspection Program (above) | "One in five inspections unacceptable" | 8 |
Files were downloaded 20–25 September 2026. The restroom register was last updated in June 2025.
Scripts
All code is R (4.6; packages sf, data.table, logistf, ggplot2, patchwork). Scripts and outputs are in the repository. A reviewer guide maps each number on the Walkthrough to the file that produces it.
| Script | What it does | Walkthrough step |
|---|---|---|
build_plan/01_prep.R | Builds the 5,814 candidate sites, the resident grid, and the restroom register with hours and inspection flags | 3, 8 |
01_features.R | Measures the law's factors at every candidate site and the 17 pilot sites | 2–5 |
05_gap.R | Pilot model, leave-one-out test, demand score, supply by hour, the gap, two-stage cover, sensitivity | 5–10, 12 |
07_private_supply.R | Chain outlets as supply under four scenarios | 13 |
08_citywide.R, 09_resident_coverage.R | Coverage beyond the busiest third; residents covered at 9pm and new restrooms needed | 11 |
12_visual_guide.R | The nine step-by-step maps of Lower Manhattan | Visual guide |
11_late_night.R | Subway entries, complaints and open restrooms after 10pm | Limits |
04_figures.R, 06_gap_figures.R, 10_extra_figures.R | All figures on the Walkthrough | all |
Full sensitivity grid: chart of all 30 combinations of demand cut-off, evening hour, radius and park hours (existing restrooms and new units for each). The no-regret shortlist is the kept_random_weights column of gap_existing_facilities.csv. Background research on private toilets: PRIVATE_TOILET_RESEARCH.md.
To rerun: build_plan/01_prep.R (builds prep.rds; optional, since the file is included), then 01_features.R, 05_gap.R (about 2 minutes), 06, 07, 08, 09, 10 and 11_late_night.R, in that order. The scripts read inputs from the team's project folder; the prepared inputs file (prep.rds, built by build_plan/01_prep.R) is in the repository under analysis/city_criteria/cache/.
Contributions
Who found or built what, and where it appears.
| Contributor | Contribution | Where it appears |
|---|---|---|
| Giorgia | Direction: learn the City's criteria from the 17 pilot sites, then score and allocate locations; the 500 m service standard | The core approach (Walkthrough steps 4–10); 500 m throughout |
| Steph, Giorgia | The 17-unit pilot and its site list (Mayor's Office) | Reference sites for the weights (steps 4–6); pilot cost (step 11) |
| Steph | Source review identifying DOT's modelled pedestrian demand (fwpa-qxaf) | Foot-traffic factor and busy-street candidate sites (steps 2–3, 5) |
| Steph | Subway-station distance screen (424 complexes, 42 priority hubs) | Archived analysis; the Walkthrough measures distance from every candidate site instead |
| Steph, Candy | City Council "Good to Go?" audit (NYC Council): 36 of 337 restrooms locked during posted hours | Archived analysis; supports the broken-restroom point (step 8) |
| Steph | Research pack: Local Laws 114 and 92, per-person standards, peer-city operating models, pilot cost per open hour | Background and Q&A; peer-city partner toilets (step 13) |
| Shawn | Like-for-like comparison with other cities' public toilets per resident | Archived analysis (Merged) |
| Jonathan | Complaint model and layered analysis of 29 high-complaint neighbourhoods; hours and inspection checks | Complaint check (Limits); hours and broken-restroom checks (steps 8, 10) |
Earlier analyses (the layered complaint walkthrough, its Limits and Data & code, and the Merged and Original versions) are kept under Archive.
Deck outline
37 quick slides for 12 minutes (about 20 seconds each; the model slides take longer, the map flips less): one message per slide, few words, then move on. Below each slide: what to say.
Act 1 · Hook · ~1 min
Where do you go?
Everyone needs one; in New York, finding one is hard, especially at night.
Act 2 · The case · ~1.5 min
What the City has to do
A law sets the count. It doesn't say where.
Act 3 · How we worked it out · ~5 min
Demand minus supply, on one neighbourhood
Zoom in once to show the method; zoom out once for the citywide result.
Act 4 · Closing the gap · ~2.5 min
Use what exists first, then test it
Answer, stress-test it straight away, then the count.
Act 5 · Recommendation · ~2 min
What the City should do
Tonight: open what exists. By 2035: build where it reaches most residents.
Backup · Q&A slides
Ready if asked
- "You reverse-engineered a 10pm pilot and called it need." The 954 → 57 drop is from the register, not the model; 200 random weightings still give existing restrooms first and 16–38 new units.
- Why do parks close at 4pm, and what would longer hours cost? No cost figure yet; estimate with Parks (staffing, safety, servicing).
- Doesn't the model ignore poorer areas? Equity had no clear effect; kept at 5% because the law names it; the resident scenario covers every neighbourhood.
- What about after 10pm? Late-night table (site, Limits tab).
- 975 + 830 ≈ 1,805, not 2,120. The count goes beyond access; the rest is a choice (e.g. capacity in the busiest places).
- What if the pilots aren't open yet? 1,357 gap sites, 162 existing, 25 new.
- Why 500 m? At 400 m: 192 existing, 56 new. Distances are straight-line.
- Complaint hotspots map; the full model table; the sensitivity grid (site, Limits and Data & code tabs).
The demand and supply model in point form: the data, the method, the numbers and the checks behind them. For preparing Q&A; the full write-up is in the Walkthrough.
THE WHOLE THING IN 30 SECONDSDemand − Supply = Gap
② measure crowds + need around each one
③ logistic regression on the City's 17 pilot picks → weights
④ score every spot: 95% crowds + 5% need
⑤ top third = busy: 1,939 spots
⑥ supply = working restrooms open within 500 m
⑦ gap = busy spots with nothing open at 9pm: 1,246 (only 83 at 2pm)
- Question: Local Law 58 wants 2,120 public restrooms by 2035; 975 are listed. Where is access missing?
- The law names six factors but no weights.
- Our idea: learn the weights from the City's own first decisions, its 17 pilot sites.
- Finding: the shortage is mostly in the evening: 93% of gap spots had a restroom nearby by day.
THE DATAEight sources, all public
| Dataset | From | Date | Used for |
|---|---|---|---|
| Public restroom register | NYC Open Data (i7jb-7jku) | Jun 2025 | 975 restrooms, operator, hours |
| Parks inspections | NYC Parks | to Jun 2026 | which restrooms are broken or closed |
| Residents, poverty | US Census ACS | 2020–24 | population; equity (need) |
| Jobs | US Census LEHD | 2023 | commercial & tourist areas |
| Subway entries | MTA | 2025 | transit |
| Pedestrian demand | NYC DOT (fwpa-qxaf) | Sep 2026 | foot traffic |
| Parks land, plazas | NYC Parks; DOT (k5k6-6jex) | 2026 | where a spot can go |
| 17 pilot sites | Mayor's Office | 16 Sep 2026 | the outcome the model learns from |
Snippet · the spots table (one row per spot)
| Spot | Type | Pilot? | Residents | Jobs | Subway / yr | Poverty | Nearest open 9pm |
|---|---|---|---|---|---|---|---|
| A · SoHo | busy street | 0 | 12,053 | 59,879 | 13.1M | 4% | 731 m |
| B · Chinatown | park | 0 | 18,730 | 16,207 | 0 | 54% | 959 m |
| Yankee Stadium | park | 1 | 12,810 | 2,639 | 6.3M | 40% | 1,494 m |
| Cooper Square | plaza | 1 | 29,223 | 35,028 | 19.2M | 8% | 955 m |
| Marine Park | park | 0 | 2,633 | 1,319 | 0 | 27% | 2,054 m |
- Counts are within 500 m of the spot (foot traffic: streets within 250 m). Poverty = the spot's census tract.
- Pilot? = 1 for the City's 17 sites: the 0/1 outcome of the regression.
Snippet · the restroom register
| Restroom | Operator | Posted hours |
|---|---|---|
| Ben Abrams Playground | NYC Parks | 8am–4pm, open later seasonally |
| Castle Clinton | Battery Conservancy | 9am–4:30pm |
| Grand Central Pkwy Gas | Parks concessionaire | 24 hours |
| A public library branch | NYPL | Mon–Thu 9am–7pm; Sun closed |
- 975 listed: NYC Parks 656, NYPL 84, Parks concessionaires 71, Queens Library 60, Brooklyn Library 55, others.
- 641 Parks restrooms post only "8am–4pm, open later seasonally" → we use 4pm (biggest assumption; tested).
STEP 15,814 possible spots
- A pin every 150 m, only on public space a modular unit could use:
- Parks land 4,076 · busy-street frontage 1,646 · DOT plazas 92
- Same kinds of places as the City's 17 (6 plazas, 7 parks, 4 street corners).
- Spots, not restrooms. None checked for space, utilities or permits.
- Lower Manhattan example square: 97 spots.
STEP 2Measure the law's six factors at every spot
| Law's factor | We measure | Role |
|---|---|---|
| Population density | residents within 500 m | Crowds (busyness) |
| Foot traffic | DOT pedestrian demand | |
| Public transport | subway entries within 500 m | |
| Commercial & tourist | jobs within 500 m | |
| Equity | tract poverty rate | Need |
| Distance to restroom | to nearest open at 2pm / 9pm | Supply |
Two transformations (why: the units are wildly different)
- Log the counts: subway runs from 0 to millions; log stops a few giants dominating.
- z-score each one: 0 = a typical spot, +1 = one standard deviation (SD) above.
- The four crowd measures move together (correlation 0.52–0.81) → averaged, then re-standardised, into one busyness score.
- SoHo: residents +0.68 · foot −0.05 · subway +1.39 · jobs +1.33 → crowds +0.95 · poverty −0.68
- Chinatown: residents +0.82 · foot −0.10 · subway −0.74 · jobs +0.89 → crowds +0.25 · poverty +2.87
STEP 3The model: logistic regression (Firth)
- Outcome: picked by the City for its pilot? 1 = yes (17 sites), 0 = no.
- Compared against: 5,756 possible spots more than 300 m from any pilot (5,773 rows in total).
- Inputs: crowds · distance to an open restroom at 2pm · at 9pm · poverty · site type (plaza / street vs park).
- Fitted in R with
logistf.
- Like linear regression, but the outcome is yes/no.
- Predicts the log-odds of "yes"; turned into a probability between 0 and 1.
- Each coefficient = change in log-odds for +1 SD of that input, holding the other inputs fixed (plaza / street: vs a park spot).
- ecoefficient = odds ratio ("times the odds").
- Same logistic regression, with a small penalty added to the fitting (penalised likelihood).
- Why: only 17 "yes" out of 5,773. With so few events, ordinary logistic regression gives estimates biased away from zero, or infinite ones (separation).
- Firth shrinks them towards zero: more conservative, more stable.
- A common fix for small samples and separation (Firth 1993; widely used in medicine).
- Caveat: with rare events it can nudge predicted probabilities slightly upwards, so treat 0.15% / 1.5% / 0.4% as approximate.
- Read the output exactly like normal logistic regression.
STEP 4The results
| Input | Coef. | p | Odds × | 95% CI |
|---|---|---|---|---|
| Crowds | 2.55 | <0.001 | 12.9 | 1.35 to 3.79 |
| Distance, 2pm | 0.71 | 0.03 | 2.0 | 0.08 to 1.46 |
| Distance, 9pm | 0.96 | 0.01 | 2.6 | 0.19 to 1.84 |
| Need | 0.12 | 0.59 | 1.1 | −0.37 to 0.52 |
| Plaza vs park | 1.61 | 0.02 | 5.0 | 0.23 to 3.04 |
| Street vs park | −2.13 | 0.02 | 0.12 | −3.90 to −0.31 |
- Crowds dominate: +1 SD busier → about 13× the odds of being picked (95% CI: ×3.8 to ×44).
- Distance matters: the City picked spots farther from an open restroom (both distances combined: 1.67, CI 0.70–2.77).
- Need: not significant. CI crosses zero → no clear pattern with poverty, either way.
- Intercept −6.53 → an average park spot: 0.15% chance. Average across all spots: 17/5,800 ≈ 0.3%.
- A spot with SoHo's crowds and need (as a park at average distance): 1.5%, 5× the average · Chinatown's: 0.4%.
- "Not significant" ≠ "no effect". It means the data can't tell (and 17 is small).
- We can't know the City's intent, only what its picks have in common.
STEP 5Does it hold up? Leave-one-out cross-validation
- Test: hide 1 pilot site → refit the model on the other 16 → where does the hidden site rank among ~5,800 spots? Repeat 17 times.
- Same idea as train/test (S7), with each site as its own test set.
- One miss: Admiral Farragut Playground, 37%.
- One-liners: the full model (97%) beats ranking by subway riders alone (75%). Population inside the same model: 93% (close; we keep all four because the law names them).
- Honest caveat: the people-only score we map ranks hidden pilots at about the 73rd percentile, no better than raw crowds. The model's edge comes from distance and site type; distance we use as supply.
- In-sample AUC 0.91; the leave-one-out ranking is the fairer test.
STEP 6From model to a score for every spot
- Take the people part of the model only: crowds 2.55, need 0.12.
- Shares: 2.55 ÷ (2.55 + 0.12) = 95% crowds · 0.12 ÷ 2.67 = 5% need.
- Score = 0.95 × crowds + 0.05 × need → rank all 5,814 → top third = busy (1,939).
| Spot | Crowds | Need | Score | Rank |
|---|---|---|---|---|
| Union Square | +1.73 | −0.27 | 1.63 | #55 |
| A · SoHo | +0.95 | −0.68 | 0.87 | #1,412 busy |
| Prospect Park (cut-off) | +0.52 | +0.28 | 0.51 | #1,939 |
| B · Chinatown | +0.25 | +2.87 | 0.38 | #2,088 just misses |
| Marine Park | −1.84 | −1.00 | −1.80 | #5,814 |
- Scores shown recompute from the rounded 0.95 / 0.05 formula; ranks use the exact weights.
- Busy spots: 1,570 of 1,939 in Manhattan; 14 of the 17 pilot sites are in the top third (expected: the weights came from them).
Why is distance in the model but NOT in the score?
- Model's job: understand why the City picked its 17. It looked at people and at existing restrooms, so the model needs both to separate them.
- Score's job: how many people need a restroom here. Distance isn't about people → it's supply.
- Hiring analogy: rank candidates on skills, then check the commute separately. Add "lives close" into the skills score and a weak candidate next door passes both tests for the same reason.
- Tested: distance in the score → 109 empty Staten Island spots become "busy" (e.g. a park with 105 residents, 6.4 km from a restroom); gap 1,246 → 1,486.
STEP 7Supply: what's actually open
− 81 broken (34 closed long-term + 47 failing inspections)
= 894 working
open at 2pm: 873 · at 9pm: 57
- Hours parsed from posted text into hour-by-hour availability; the few unreadable ones count as closed.
- Pilot units count as supply, open 7am–10pm.
- Served = a working restroom open within 500 m (~7-minute walk, straight line).
- All possible spots served (before pilot units): 70% at 2pm → 16% at 9pm.
STEP 8The gap
- Lower Manhattan square: 97 spots → 93 busy → 92 served at 2pm → 55 with nothing open at 9pm.
- City's own 17 sites (before their units): 13 had a restroom nearby by day, 1 at 9pm.
- Gap spots are places, not restrooms: one restroom covers many spots.
- Three-quarters of the gap is in Manhattan, where the busy spots are.
CHECKSDid we stress it? Yes
| If someone asks… | We tested | Result |
|---|---|---|
| Borough quota (4 each, 1 SI)? | model within each borough | crowds 3.04 (stronger); 99% of gap same |
| Busy at 9pm? | evening subway (6–10pm), no jobs | 93–98% of gap same |
| More weight on need? | 25% / 50% equity | 92% / 75% same |
| Different weights? | 200 random weightings | gap stays evening-led |
| One measure only? | rank by each alone | 83–91% of gap same |
| Does the mapped score pass the test? | leave-one-out, people-only score | ~73rd percentile; 16/17 beat a guess |
| Parks open to 10pm? | change 4pm → 10pm | gap 396; 24 new units unchanged |
| Pilots not open yet? | remove them from supply | gap 1,357 |
| 400 m not 500 m? | shorter walk | same pattern; more units |
| Use 311 complaints? | add to the model | adds nothing (−0.37, n.s.) |
IN CLASS OR NOT?Map to the course
| We used | Where from |
|---|---|
| Confidence intervals, significance | In class · S3 |
| Regression, standardised inputs | In class · S4–5 |
| Logistic regression; spatial distance | In class · S6 |
| Train/test → leave-one-out | In class · S7 (variant) |
| Firth correction | Beyond class: rare-event fix |
| Parsing posted hours into hourly availability | Beyond class: data engineering |
| Maximal covering (closing the gap, Act 4) | Beyond class: facility location |
TERMSGlossary
- Log-odds: log(p ÷ (1−p)). What logistic regression predicts. 0 = 50/50.
- Odds ratio: ecoef. 12.9 = "12.9 times the odds".
- Standard deviation (SD) / z-score: how far from typical; "one step" in our charts.
- 95% confidence interval: a range built so that, in 95 of 100 repeat samples, it would capture the true effect. Values inside it fit the data.
- p-value: chance of a result at least this strong if there were truly no effect. <0.05 = significant.
- Firth / penalised likelihood: logistic regression adjusted for rare events.
- Leave-one-out cross-validation: train on all but one, test on the one left out; repeat.
- AUC: chance the model ranks a random picked site above a random non-picked one (0.5 = guessing).
- Census tract: small Census area of about 4,000 people.
- Busy spot: top third by demand score (1,939). Gap: busy + nothing open within 500 m at 9pm.
Q&AThe ones to have ready
"Isn't learning from the City's picks circular?"
- The weights describe what the City's picks have in common, not proof of need.
- Used for demand only. Our finding is about supply (closed at night), which doesn't depend on the weights.
"17 is tiny."
- Firth correction for rare events.
- Leave-one-out: top 3% typical, 16/17 beat a guess.
"Why not just population?"
- Inside the full model, population alone ranks almost as well (93% vs 97%); raw subway ranking only 75%.
- We keep all four: the law names them, and the data can't separate them.
"Does the model ignore poor areas?"
- Need isn't significant in the City's picks; kept at 5% because the law names equity.
- At 25% weight, 92% of the gap is unchanged; for individual places it decides (Chinatown gets in). A value choice for the City.
"What's Firth? Is it in class?"
- Logistic regression (in class) + a penalty that stops estimates blowing up with very few events.
- Same reading of coefficients; more conservative.
"Where's the data from?"
- NYC Open Data (restrooms, DOT, Parks), US Census (ACS, LEHD), MTA, Mayor's Office pilot list. See Data.
"Do parks really close at 4pm?"
- Posted rule; biggest uncertainty. At 10pm the gap is 396 and only 37 existing restrooms need action; still 24 new units.
"Why not count cafés?"
- Not public (purchase rules, no right of use). A paid partner scheme is a scenario in the recommendation, not supply.
Layered walkthrough
Archived 26 September 2026. This is the earlier complaint-led analysis. Its checks on evening hours and broken restrooms are reused in step 8 of the Walkthrough.
In one minute
- Question. New York has committed to 2,120 public restrooms by 2035; its register lists 975. Where should the City act first?
- Screen. 29 neighbourhoods file at least 1.5 times the complaints their crowds would predict.
- Diagnose. In each, is a restroom missing by day, closed by evening, or out of order?
- Act. Prioritise repairs in 3 neighbourhoods. Test longer opening hours in 13. Of the 12 that lack a restroom nearby even by day, check new sites first in 6 priority build areas (about 7 modular units), and verify demand in the other 6. Assess Midtown separately.
- Learn. Roll each change out in random order and measure what it changes.
These are priorities for investigation and testing. Complaint records show reported problems; they do not directly measure unmet need or prove that any action will work.
1 — The question and the approach
- Local Law 58 (2025) sets a target of 2,120 public restrooms by 2035, a gap of 1,145 on today's register. The City's siting strategy is reportedly due on 1 Nov 2026 (PIX11). From a source
- The register lists 975 working public restrooms, 656 of them run by NYC Parks and most of the rest in libraries. Only 8 are open 24 hours, all highway gas stations or a snack bar.
- A 17-unit modular pilot began in September 2026: $4M, one year, open 7am–10pm. From a source
No dataset records "needed a toilet and couldn't find one", so we work in two steps. First, complaints show where there is a problem. Then three checks show what kind of access gap is there: a restroom missing, closed, or out of order. Each kind points to a different action.
| Layer | Question | Points to |
|---|---|---|
| 1. Problem | More complaints than the crowds predict? | The 29 high-complaint neighbourhoods |
| 2. Missing | No restroom open within 500 m, even by day? | New-site feasibility checks |
| 3. Closed | A restroom by day, none by 9pm? | Longer opening hours |
| 4. Out of order | Coverage depends on closed or failing restrooms? | Repair or reopening |
One result shapes the whole plan: once crowds are accounted for, the supply measures we tested did not predict complaints. So whether more or longer-open restrooms reduce complaints is an open question: the layers tell the City what to try in each place, and the trials in section 8 are how it learns what works.
Tags mark where each result comes from: In class · S5 a technique from the course, applied to the data; Beyond class an analytics technique outside the course; From a source a fact looked up rather than calculated.
2 — Layer 1: 29 neighbourhoods file far more complaints than their crowds explain
Busy places always generate more complaints, so the signal is an area filing more than its crowds predict.
- We use 311 "Urinating in Public" complaints: 7,926 from 2020 to 2026. The top 1% of addresses file 22.3% of complaints in public places, so each address counts once a month. S1–2 · data cleaning
- A count model predicts each of 197 neighbourhoods' expected complaints from its subway riders, workers, hotels, residents, borough and age mix. Beyond class · negative binomial regression
- On neighbourhoods it had not seen, the model ranks them by complaints better than subway ridership alone: rank correlation 0.79 against 0.70, outperforming the benchmark in 96% of 200 test splits. S4, S7 · correlation, train/test
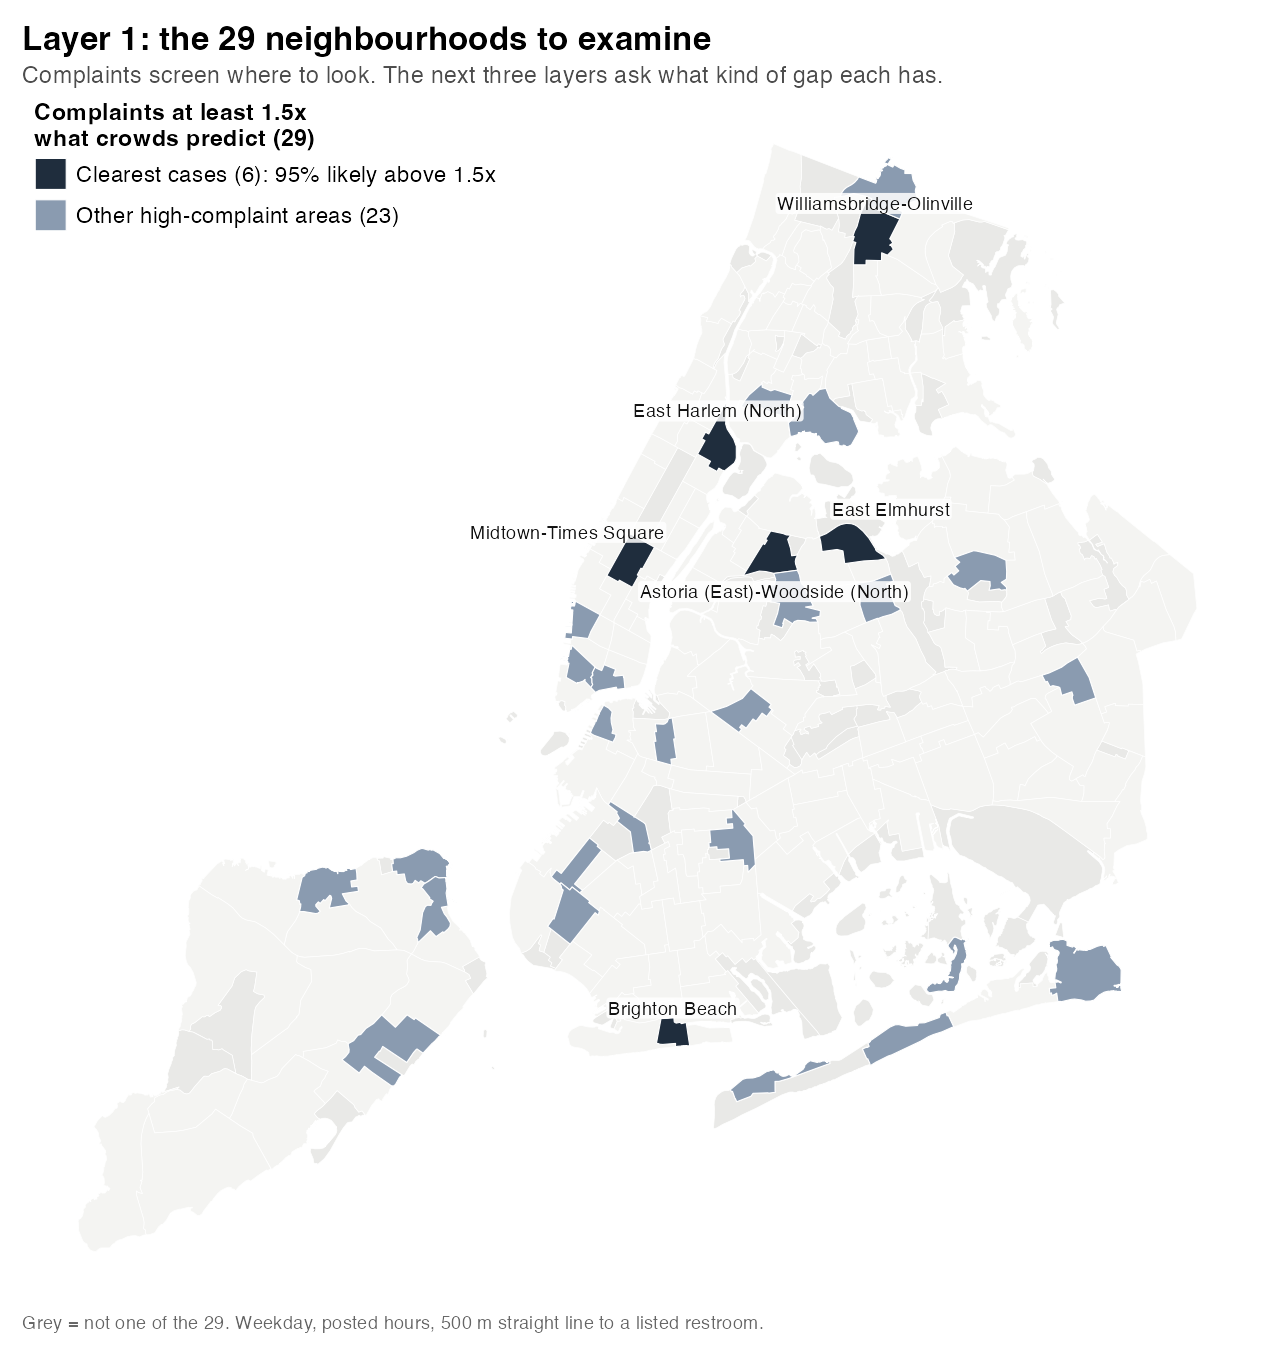
- 29 neighbourhoods file at least 1.5 times what their crowds predict. For six of them, which we call the clearest cases, it is at least 95% likely that complaints genuinely run above 1.5 times expected: East Harlem (North), Astoria (East)–Woodside (North), East Elmhurst, Williamsbridge–Olinville, Brighton Beach and Midtown–Times Square. Beyond class · empirical Bayes
We treat the 29 as a wide net, not a verdict: complaints also reflect who chooses to report, and the list shifts between years and when only phone reports are counted. The next three layers decide what each of the 29 needs.
3 — Layer 2: in 13 of the 29, most residents have no restroom nearby even by day
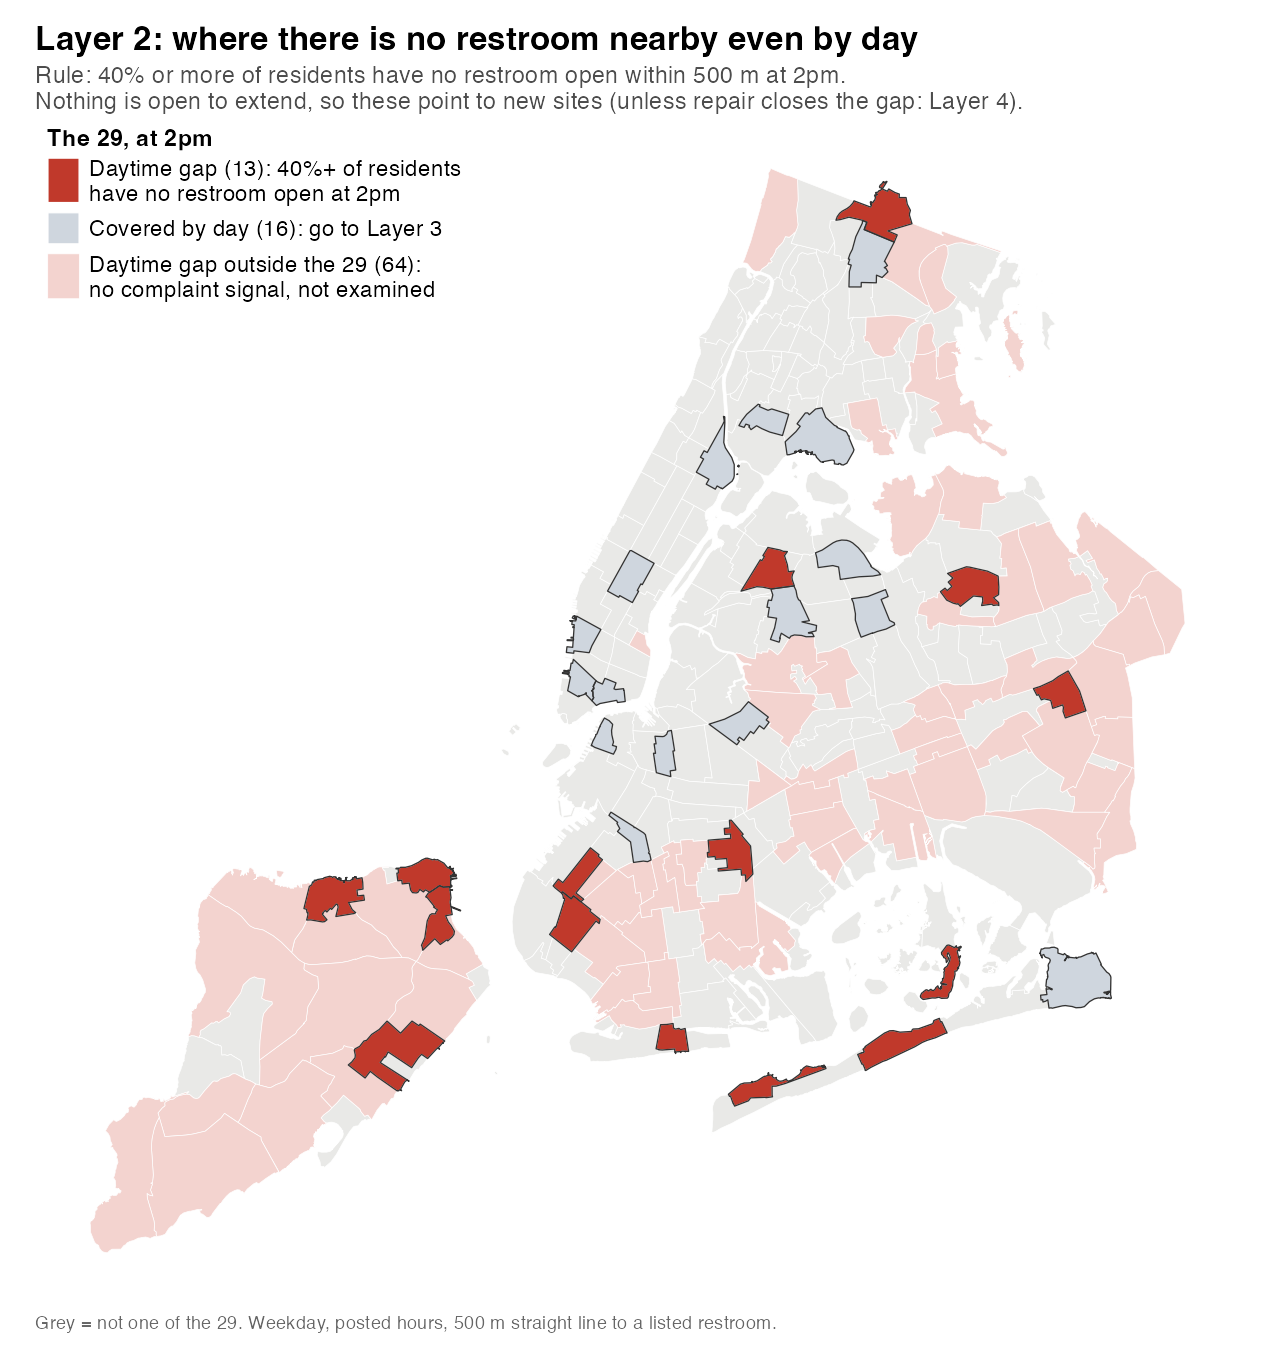
13 of the 29 have a daytime gap: 40% or more of their residents have no restroom open within 500 m even at 2pm. A daytime gap is common in lower-density areas: 77 of all 197 neighbourhoods have one, mostly in Staten Island and eastern Queens.
We call an area's coverage the share of its residents with a restroom open within 500 m, about a 7-minute walk; changes in coverage are given in percentage points (points). Citywide, 72% of residents are covered at 2pm. S6 · spatial analysis
4 — Layer 3: at night, even the busiest places have almost nowhere to go
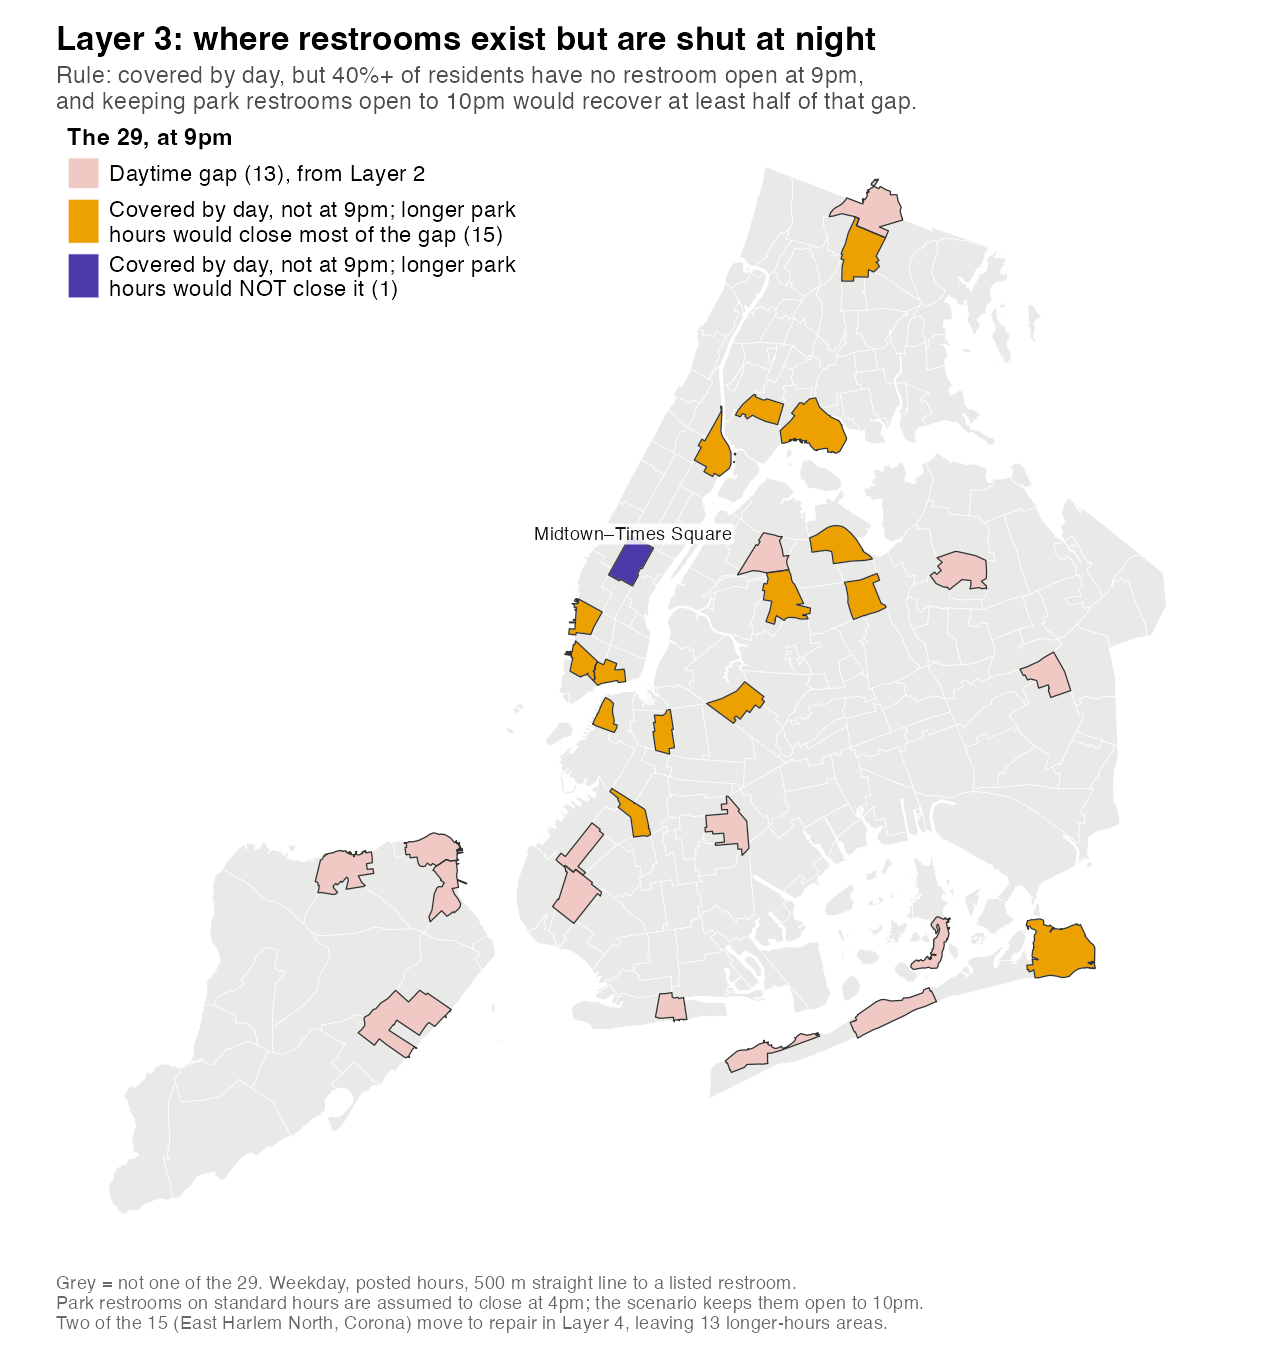
Of 975 listed restrooms, 954 are open at 2pm on a weekday and only 57 restrooms at 9pm. We turned each restroom's posted hours into hour-by-hour availability. Beyond class · parsing opening hours
| Weekday | 2pm | 9pm |
|---|---|---|
| Residents with an open restroom within 500 m | 72% | 4% |
| 50 busiest subway stations with none within 500 m | 4 | 43 |
| Busiest streets (DOT) with none within 500 m | about 3% | 64% |
The 9pm station figure is 20 if park restrooms stay open to 10pm.
- Complaints lean to the evening: 30% of public-urination complaints are filed between 6pm and midnight, against 18% of another 311 type, dirty streets. S1–2 · descriptive comparison
- 641 park restrooms post only standard hours ("8am–4pm, open later seasonally"). In an uncosted comparison, keeping these existing restrooms open to 10pm would add 57 points of coverage for residents at 9pm; 100 new restrooms would add 27 points.
- 13 of the 29 are longer-hours areas: residents are covered by day but not at 9pm, and longer park hours would recover most of that evening gap.
5 — Layer 4: one in five restroom inspections found the restroom unacceptable
In January–June 2026, one in five inspections of Parks restrooms found them unacceptable, back to levels last seen in 2012–14.
Parks keeps its own inspection list of 736 restrooms (it calls them comfort stations), including closed ones; the City's register counts 656 working Parks restrooms. Inspectors rate each one acceptable or unacceptable on a schedule: 25,912 ratings are on file.
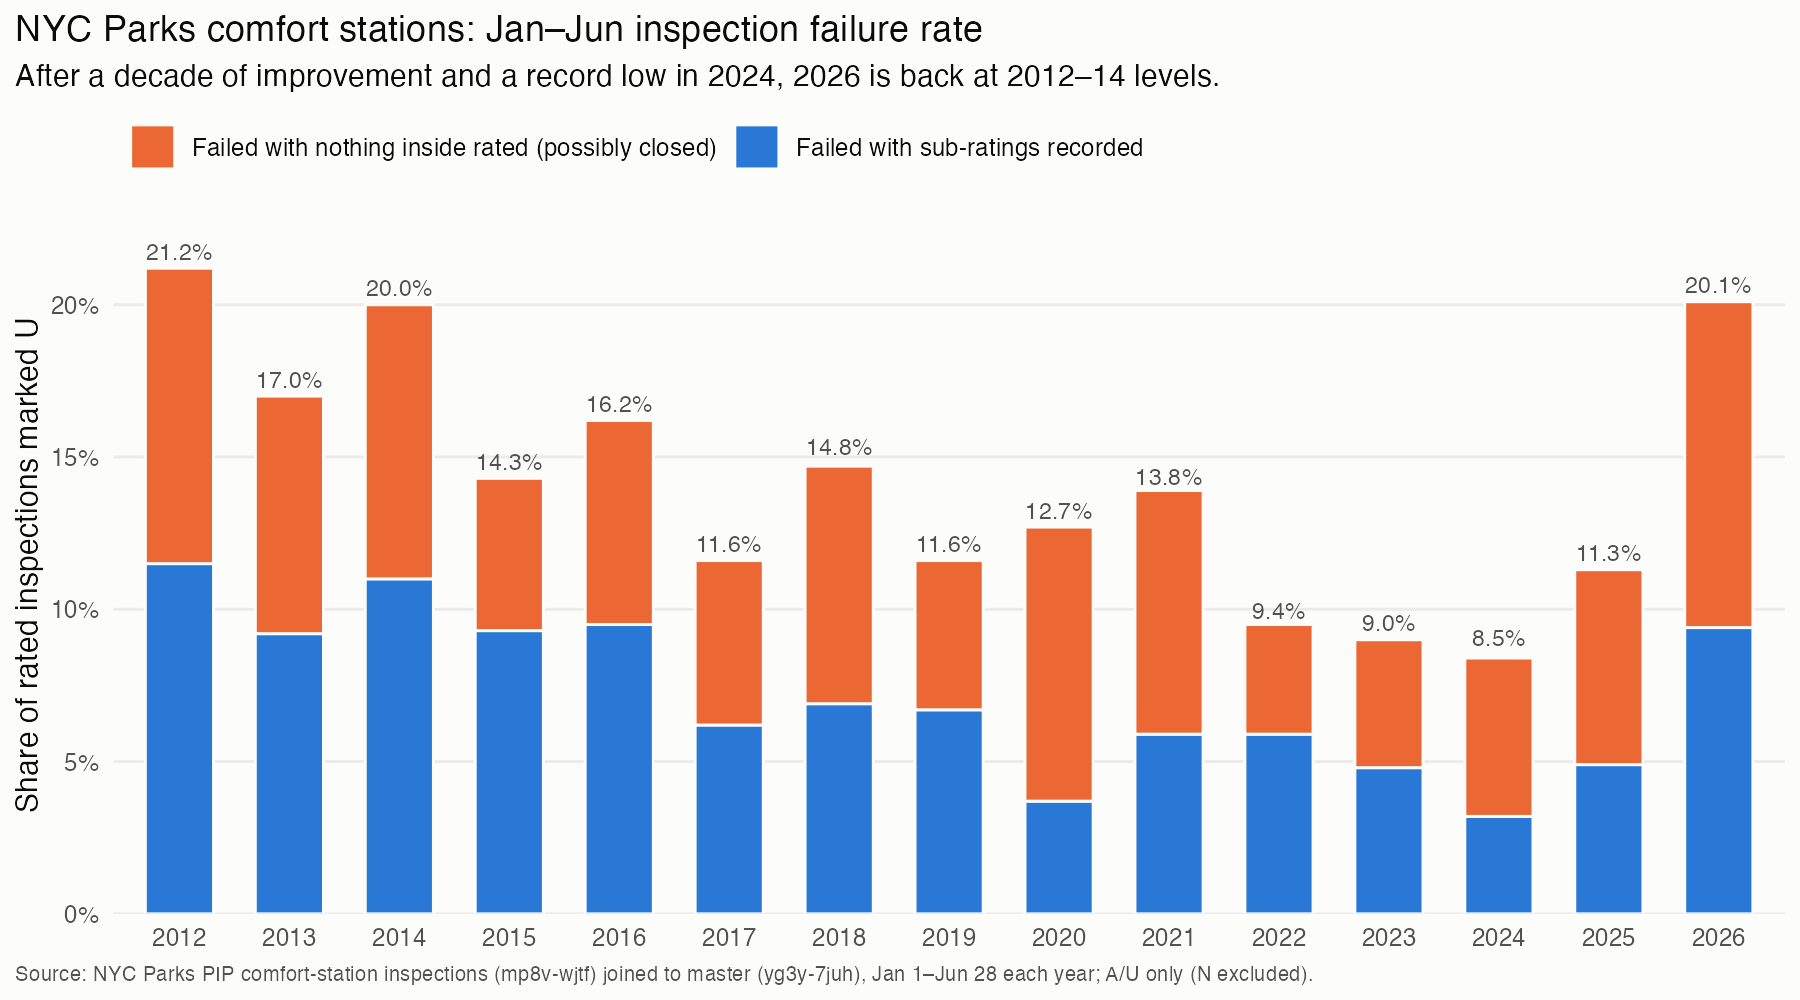
- In January–June 2026, 20.1% of inspections were unacceptable: back to 2012–14 levels after a record low of 8.5% in 2024 (+11.6 points, 95% CI 7.8 to 15.3). S3 · confidence interval
- The same buildings got worse: comparing each restroom with itself gives +11.4 points. S5 · fixed effects
- The rise persists after accounting for inspector differences: restroom failure rose 11.9 points more than the same inspectors' ratings of parks without a restroom (95% CI 7.8 to 16.0). This compares restroom ratings with whole-park ratings, so it cannot rule out a change in how restrooms alone are graded. S5, S8 · difference-in-differences
- 80 of Parks' 736 restrooms are in long-term closure, 46 for repairs; about 34 of these are still counted in the 975. Separately, the City Council's random audit found 36 of 337 rooms locked during posted hours.
- In 3 of the 29, repairing or reopening restrooms that already exist would restore 10 or more points of coverage. In Brighton Beach, reopening 4 long-closed restrooms would take coverage from 48% to 81%.
Repairs also need a way to target inspections. Ranking sites by their failure share over the past three years finds a failing restroom in about 1 in 5 extra checks, against 1 in 8 at random, on 2025–26 data the rule never saw. A logistic regression did no better and a decision tree did worse, so the simple rule is enough. S6–7 · logistic, tree, train/test
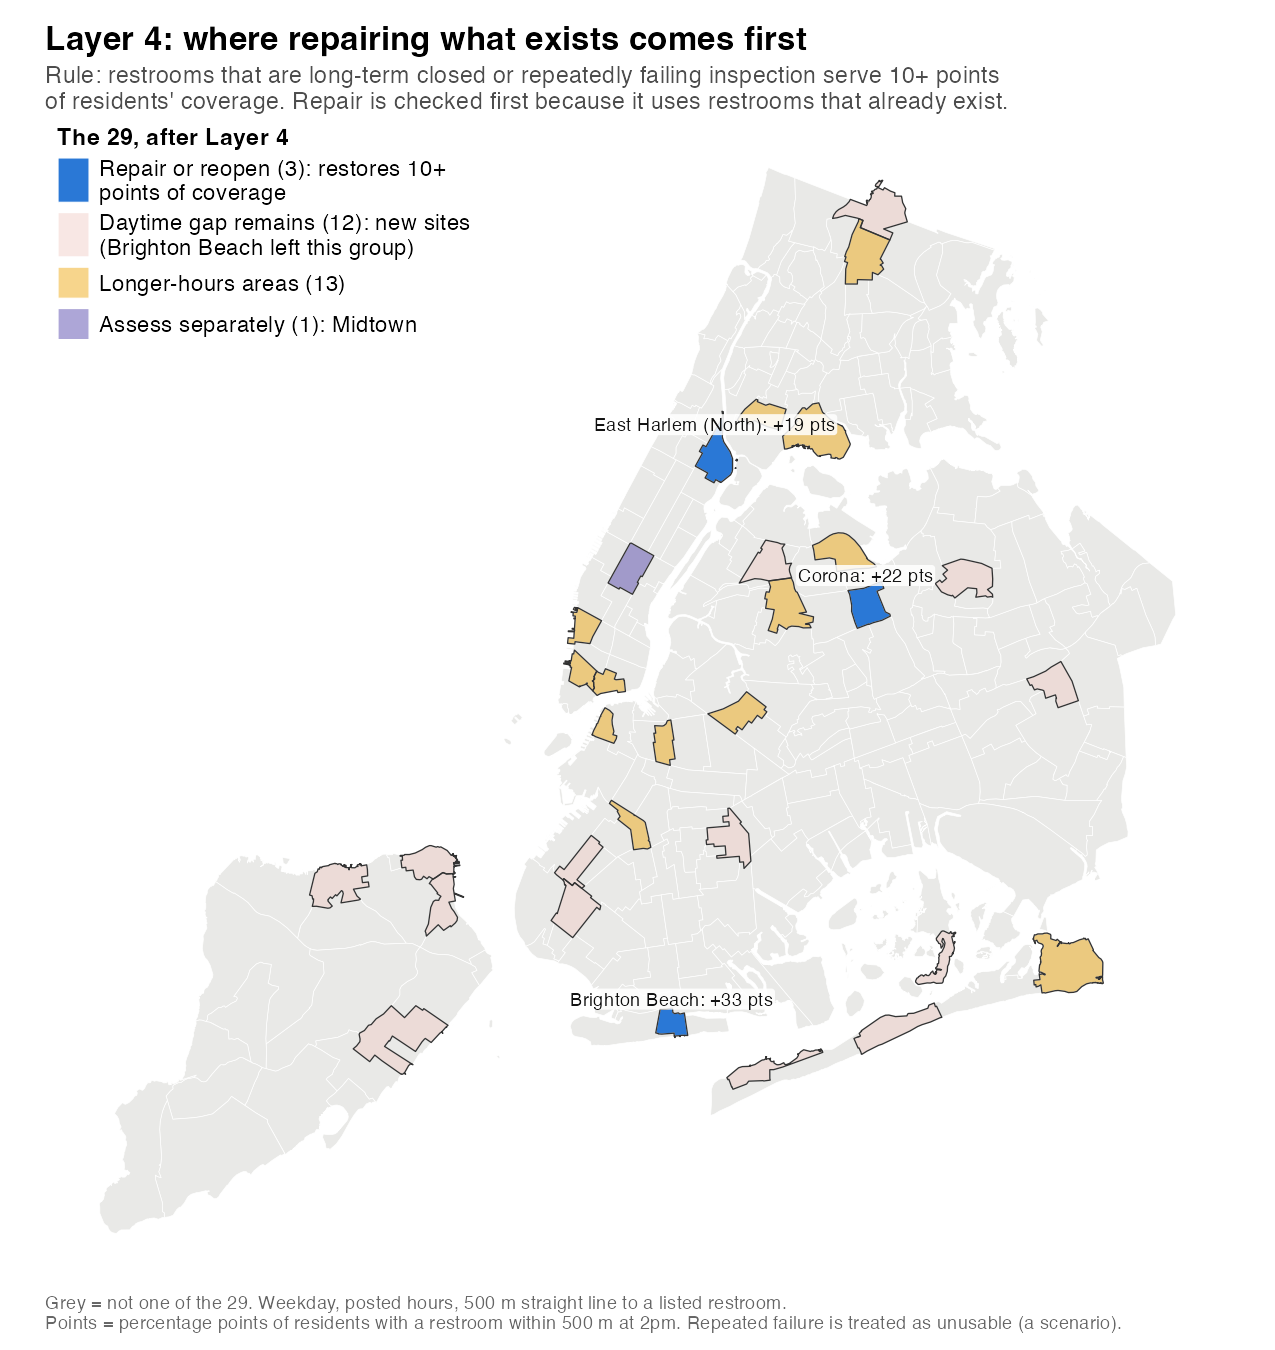
6 — Each neighbourhood gets one action, using what exists first
Where repairing or reopening existing restrooms closes the gap, repair first. Where a daytime gap remains, assess new sites. Where the gap opens only at night, test longer hours. Where none of these fits, assess the area separately.
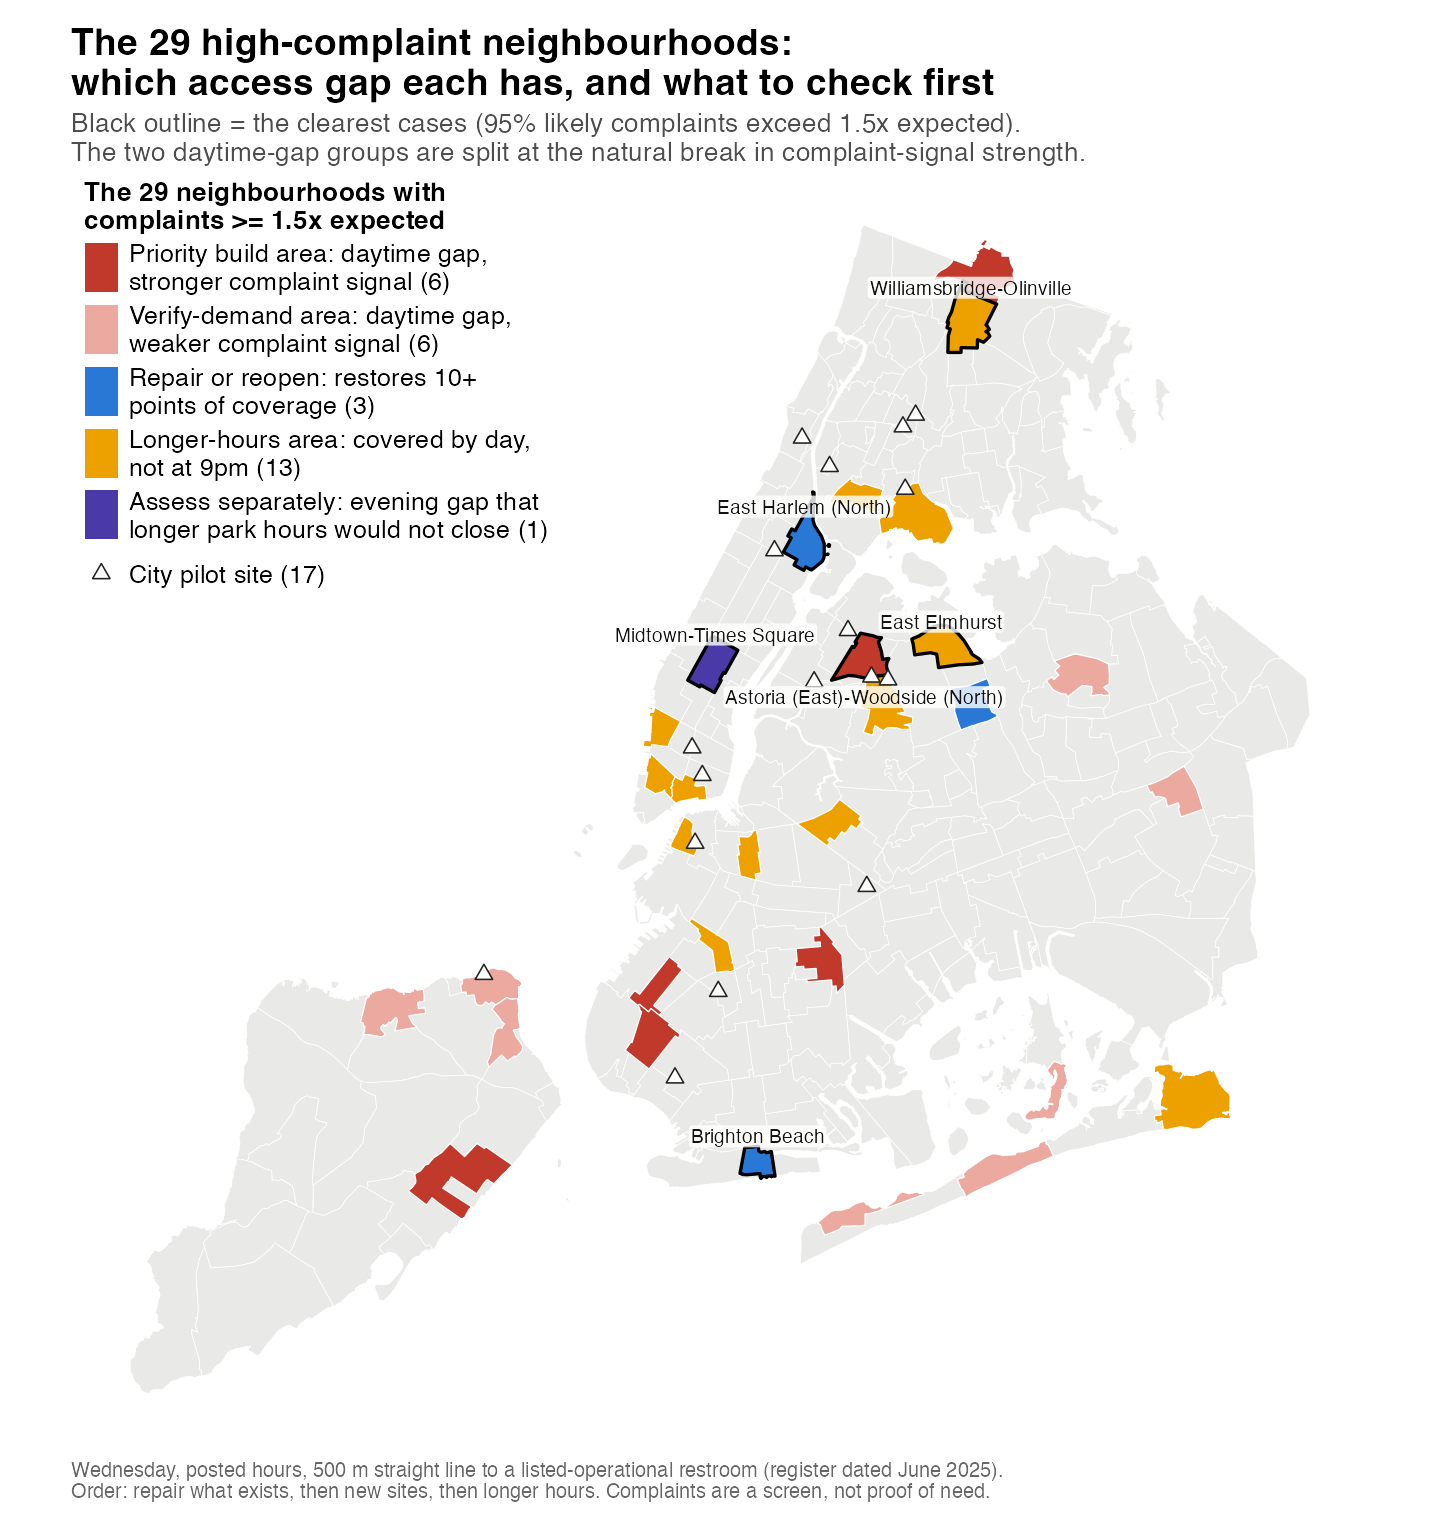
Open the interactive map: every layer's value for each neighbourhood, the pilot sites and candidate build sites.
| Action | Areas | Neighbourhoods |
|---|---|---|
| Repair or reopen | 3 | Brighton Beach, East Harlem (North), Corona; all three also have an evening gap |
| Priority build areas: daytime gap, stronger complaint signal; check new sites | 6 | Astoria (East)–Woodside (North), East Flatbush–Rugby, Wakefield–Woodlawn, New Dorp–Midland Beach, Dyker Heights, Sunset Park (Central) |
| Verify-demand areas: daytime gap, weaker complaint signal (4–15 complaints) | 6 | East Flushing, Port Richmond, Hollis, Breezy Point–Rockaway Park, St. George–New Brighton, Tompkinsville–Stapleton |
| Longer-hours areas: evening gap | 13 | East Elmhurst, Williamsbridge–Olinville, Hunts Point, Brooklyn Heights, Far Rockaway–Bayswater, Chinatown–Two Bridges, West Village, Tribeca–Civic Center, Woodside, Bushwick (West), Clinton Hill, Windsor Terrace–South Slope, Melrose |
| Assess separately | 1 | Midtown–Times Square: a 48% evening gap that longer park hours would not close, with few park restrooms nearby |
Twelve areas keep a daytime gap that repair does not close. They split where complaint-signal strength falls into two clusters: in the six priority build areas it is 80–100% likely that complaints genuinely run above 1.5 times expected; in the six verify-demand areas, 24–52%. New Dorp and Wakefield stay priority build areas under every threshold we tried; the others depend on where the lines are drawn (Limits, section 2). Beyond class · sensitivity analysis
7 — Assessing potential new sites
About 7 well-placed modular units could bring all six priority build areas below a 40% daytime gap, but most would need street sites, not park land.
We added candidate sites one at a time, each covering the most residents still without a restroom within 500 m, the standard method for placing a limited number of facilities (the Maximal Covering Location model, Church & ReVelle 1974). Beyond class · maximal covering optimisation
- On the sites we could identify (Parks land, plazas and busy-street frontage), only 2 of the six priority build areas fall below a 40% daytime gap.
- Allowing any residential grid point, about 7 units, one or two per area, bring all six below 40%, still leaving 8–33% of their residents uncovered. That points to modular street units, each needing a ground check for space, utilities and access before anything is built.
- 3 of 17 pilot units fall in the 29: 2 in build areas (Astoria, St. George) and 1 in a longer-hours area (Woodside).
8 — Two randomised trials would show what works S8–9 · A/B test design
- Hours trial. Start with the playground restrooms beside the two largest complaint hot spots, Gun Hill (Williamsbridge) and Gorman (East Elmhurst), then the 13 longer-hours areas, in random order. Measure public-urination summonses (tickets issued by police); under simplified assumptions a drop of about 33% would be detectable. Keeping restrooms open from 4pm to 10pm would cost about $2.75M for ten months for the 43 Parks restrooms in those areas, or $4.41M for all 69 listed restrooms there. Beyond class · power analysis
- Check trial. Among high-risk restrooms, randomly choose which get an extra check and repair first, and compare their next inspection.
- Pilot and new units. Judge them by the hours they are found open and working, not by units installed.
9 — Recommendation
| Step | Where | Do this |
|---|---|---|
| 1. Repair or reopen | Brighton Beach, East Harlem (North), Corona | Reopen and repair existing restrooms; target extra checks by 3-year failure history; then extend hours |
| 2. Test longer hours | 13 areas | Run the hours trial; keep park restrooms open to 10pm where it works |
| 3. Assess new sites | 6 priority build areas (about 7 modular units); then the 6 verify-demand areas | Ground-check each site; modular units first, permanent buildings only after a unit proves used and open |
| 4. Assess separately | Midtown–Times Square | Examine transit and street options, and causes other than supply, before adding restrooms |
Field checks and controlled trials should decide which of these actions go further.
Limits and open questions
What could change the answer in the Walkthrough, how much it matters, and what would settle it. The study identifies priorities for field checks and trials; it does not show that access gaps cause complaints or that any action will reduce them.
Open questions
- Do access gaps cause complaints? Not established. The layers show where gaps and excess complaints coincide. Once crowds are accounted for, the supply measures we tested did not add clear predictive power, and the complaint model already includes each area's restroom count (with no effect). Two attempts at a causal estimate did not hold: winter closures moved an unrelated comparison outcome (alcohol summonses) almost as much as public-urination summonses (rate ratios 0.699 and 0.624), and closure records turned out mostly to log construction. The trials in section 8 are how to find out.
- Do longer hours or extra checks reduce anything? Not yet measured.
- Did Parks change how it rates restrooms around the start of 2026? The failure rise builds from November 2025. The same inspectors rated parks without a restroom no worse, which argues against stricter grading in general, but not against a change for restrooms alone. About half of the rise is unacceptable records with no component ratings; closure is a possible but unconfirmed reason. Parks' rating manual would settle both points.
- Can the candidate sites be built on? None has been checked for space, utilities, approval or accessibility.
1. Which neighbourhoods are on the list
- Complaints reflect who chooses to report as well as conditions on the street. The model is tested on predicting complaint counts, not on whether the resulting list reflects need. Counting phone reports only, none of the six clearest cases stays 95% certain, and rankings for 2020–22 and 2023–26 correlate at only 0.31. All 29 need checking in the field.
- Testing 197 neighbourhoods at once: 10 are significant at the usual 5% level, about what chance alone would produce (9.9), and none survives a standard correction for multiple testing. The list says where to look, not which places are proven.
- The 29 are chosen on the raw ratio of observed to expected complaints. Where fewer than about 5 complaints are expected, 1.5 times is easy to reach by chance. Besides the six verify-demand areas, four longer-hours areas rest on similarly weak signals: Hunts Point, Melrose, Windsor Terrace–South Slope and Clinton Hill. The hours trial will test them directly.
- The model does not include nightlife or street homelessness. For Midtown–Times Square, the probability that complaints genuinely run above 1.5 times expected falls from 0.97 to 0.83 once uncertainty in the model itself is included.
2. How the action is chosen
- The categories rest on choices: 500 m, a 40% gap, 10 points of coverage for repair, 9pm, and the split of the build areas at the observed break in complaint-signal strength. The categories are exploratory: the rules were set after seeing first results. How the result moves:
| Change | Effect on the 29 |
|---|---|
| Gap threshold 30% instead of 40% | 1 area changes action |
| Gap threshold 50% | Daytime-gap areas needing new sites fall from 12 to 6 |
| 400 m instead of 500 m (missing and closed layers only) | 4 areas change |
| Repair threshold 5 points instead of 10 | Repair rises from 3 to 7 areas; Astoria, East Flatbush and Hollis move from the daytime-gap groups to repair |
| Counting any broken restroom that serves 10% or more of residents, even where other restrooms already reach them | Repair covers 12 areas instead of 3 |
| Evening hour (9pm) | Not varied |
- Of the six priority build areas, New Dorp and Wakefield keep that action under every variant.
- The order (repair, build, longer hours) is a preference for using what exists, not a cost optimisation. Longer hours are close to the default: 26 of the 29 would gain most of their evening coverage back from longer park hours, so this becomes the action wherever repair and new sites do not apply.
3. How access is measured
- Coverage counts residents only, spread evenly over a 150 m grid within each census tract and leaving out park land (0.1% fall outside residential neighbourhoods). Workers, commuters and visitors are not counted, which favours lower-density areas (77 of 197 neighbourhoods have a daytime gap) and understates need where few people live, such as Midtown.
- Distances are straight-line, so real walks are longer, and nearness says nothing about capacity, entrances or queues.
- Hours are as posted. Park restrooms on standard hours are assumed to close at 4pm; the longer-hours scenario keeps them open to 10pm. If some actually stay open at 9pm, the evening gaps and some actions would change; seasonal hours need checking on site. 18 listed restrooms with blank or unreadable hours count as closed. Station and street figures are for Monday–Thursday; on Friday evening libraries close at 5pm.
- "Missing" means no listed restroom open at 2pm within 500 m, using the City register (last updated June 2025), which does not show that a new building is the only fix.
- The repair indicator is a scenario. It combines coverage at risk from listed restrooms that inspections show closed or repeatedly failing (treated as unavailable) with coverage gained by reopening long-closed ones. Restrooms are matched to the register by location, not a verified asset list; five are placed at one point inside their park, including two seasonal Coney Island beach stations. Each needs checking before a repair is promised.
- Complaint times are when the complaint was filed, not when the incident happened. DOT's pedestrian demand is modelled, not counted; adding it did not improve the complaint model.
4. Inspections and the check rule
- 2024 is the lowest January–June failure rate in 22 years; 2026 is back at 2012–14 levels.
- The 3-year rule finds failures the next regular inspection would also record: better detection, not proven prevention. It was 5th of 6 candidates in the 2024 validation year and matched the model on 2025–26, so its relative performance is not stable. It is a candidate to pilot, not a proven rule.
- Neighbourhood failure rates for 2026 rest on 2–18 inspections each, so they are not used to choose actions; the closure and repeated-failure indicators are.
5. Costs and trials
- Capital costs are funding figures, not final costs: a new building's median is about $4M, a reconstruction about $1.5–1.8M. The only modular figure is the pilot's $4M for 17 units including a year of service, a service contract rather than a capital price, so the build recommendation is not costed.
- The hours-trial budget is illustrative: 6 extra staffed hours a day at an assumed $35 an hour, without supervision, supplies, security or evaluation.
- The detectable drop of about 33% in summonses comes from a simplified calculation that ignores clustering within the 13 areas, overdispersion and the staggered rollout, and counts summonses at all hours. The real detectable drop is likely larger; power must be recalculated for the final design. Summonses reflect enforcement as well as behaviour: alcohol summonses serve as a comparison outcome for changes in policing, not a guarantee against it. Trials should also record whether restrooms are open and working.
- The coverage comparison between longer hours (641 existing restrooms) and 100 new restrooms is uncosted and differently sized; it does not show cost-effectiveness.
6. Data dates
- Restroom register: June 2025. Inspections: to 28 June 2026. Complaints: 2020 to September 2026. Pilot sites: 16 September 2026 announcement. The sources describe different periods, so restroom status and hours should be refreshed before any action.
Archived version of 24 Sep 2026 (the merged walkthrough), kept for comparison. Some figures and claims are superseded — current figures are in the Walkthrough.
Merged walkthrough (24 Sep)
0 — The situation
- Local Law 58 of May 2025 sets a target of 2,120 public restrooms by 2035. The City's register lists 975 operational today, so the gap is 1,145.
- The City's siting strategy under the law is due on 1 Nov 2026.
- Earlier laws asked for sites without funding them: Local Law 114 of 2022 wanted a feasible site in every ZIP code area, and Local Law 92 of 2025 reports on the projects at those sites. Team research · Steph, Candy
New York has about a third of the public toilets per resident of the best-served cities. Counted the same way, as government-run toilets on streets, in parks and plazas and at transit stops, it has 9.0 per 100,000 residents. Team research · Shawn (idea)
| City, one counting rule | Public toilets per 100,000 residents |
|---|---|
| Paris | 27.2 |
| Zurich | 24.8 |
| San Francisco | 24.7 |
| Vancouver | 15.4 |
| Hong Kong, FEHD list only | 10.1 |
| Toronto | 9.7 |
| Berlin | 9.2 |
| New York City | 9.0 |
Hong Kong's list excludes park toilets run by another department; with an approximate count of them it is about 18.4.
Toronto and Berlin are close to New York, so the gap is with the leaders, not with every large city.
The City has already started a 17-unit modular pilot:
| The pilot | Detail |
|---|---|
| Units | 17 modular restrooms |
| Start | September 2026, for one year |
| Budget | $4M |
| Open | 7am–10pm |
| Sites, published 16 Sep | None in Midtown; 4 in western Queens, 13 elsewhere |
Sources: PIX11, Aug 2026, for the deadline; NYC Mayor's Office release of 16 Sep 2026 for the pilot and its sites Team research · Steph, Giorgia.
The City has four decisions to make: where to put restrooms, when they need to be open, what to do first, and how to measure the pilot it has already started. The sections below take each in turn.
1 — Where
Data cleaning, negative binomial regression, out-of-sample validation, hot-spot mapping
The signal is 311 "Urinating in Public" complaints. Nobody records "needed a toilet and could not find one". This is the closest thing that is dated and mapped: 7,926 complaints from 2020 to 2026.
Clean it first. The top 1% of addresses produce 22.3% of complaints. In East Harlem, 223 of 384 complaints came from five addresses on one block.
Keeping complaints in public places leaves 4,706, and counting each address at most once a month leaves 3,629. Otherwise five addresses on one block would set East Harlem's rank.
Adjust for crowds. Busy places generate more complaints. For each of 197 neighbourhoods, the model predicts the complaints it would normally produce, given its subway riders, jobs, hotels, residents, income, age mix and borough.
Observed ÷ expected is the unmet-need ratio. Brighton Beach, for example, had 24 complaints against 6.2 expected: a ratio of 3.85×.
Test it against a one-line rule. The rule ranks neighbourhoods by subway ridership alone. The model is fitted on 70% of neighbourhoods and scored on the unseen 30%, over 200 random splits.
On rank agreement with actual complaints, the model scores 0.788 against the rule's 0.703. It wins in 96% of 200 splits.
Shaded by observed ÷ expected complaints. Grey means the two match; stronger colour means more complaints than the area's crowds explain.
The answer: 29 neighbourhoods sit at 1.5× or more of their expected complaints. Six clear 0.95 probability that their true complaint rate is above 1.5× expected: East Harlem (North), Astoria (East)–Woodside (North), East Elmhurst, Williamsbridge–Olinville, Brighton Beach and Midtown–Times Square. Interactive map.
That confidence is about excess complaints. Re-ranked on phone-filed complaints alone, 4 of the six fall out of the top 25, so it is weaker evidence of excess need.
Where exactly: the complaint map shows the blocks. Within each of the six, complaints cluster in a few hot spots. The table shows the largest one, whether it sits beside a subway station, and which agency controls the ground.
| Area | Largest hot spot | Complaints | Beside a station? | Natural owner |
|---|---|---|---|---|
| East Harlem (North) | E 122 St between 2nd and 3rd Ave | 42 | Mixed: 3 of 5 hot spots | DOT, street frontage |
| Astoria (East)–Woodside (North) | 28 Ave at 56 Pl. Thin: 3 addresses, none after 2022 | 36 | No: 0 of 2 | DOT, street frontage |
| East Elmhurst | 25 Ave at 85 St, beside Gorman Playground | 20 | No: nearest station 1.7 km | Parks |
| Williamsbridge–Olinville | Cruger Ave at Magenta St, beside Gun Hill Playground | 17 | Mixed: 1 of 2 | Parks |
| Brighton Beach | Ocean Parkway malls at the Ocean Pkwy station. Thin: 24 complaints in the whole area | 4 | Mixed: 2 of 3 | MTA / DOT |
| Midtown–Times Square | Central Park South at 57 St and 7 Ave | 17 | Yes: 5 of 5 | MTA / DOT |
In Midtown the complaints cluster at station exits. In East Elmhurst and Williamsbridge it sits at playgrounds whose restrooms are locked at night. Astoria's hot spot rests on 3 addresses and stops in 2022, so it may reflect one persistent caller or a problem that has ended.
A hot spot counts as beside a station when its centre is within 250 m of one. The owner follows a stated rule: beside a station, MTA or DOT; within 60 m of a park, Parks; otherwise DOT. It starts a discussion; it does not settle one.
The pilot mostly misses the need. 1 of 17 units sits in one of the six, at Northern Blvd and 54 St, on the area's boundary. 3 of 17 are in the 29, and the typical site's neighbourhood ranks 82nd of 197.
The ranking's value is in where the next units go. The pilot is already sited; the LL58 strategy decides the next 1,145.
Caveat: the 1.5× cut-off is a budget line, not a natural boundary.
2 — When
Hours parsing, walking distance by hour, complaint timing
Access collapses in the evening. Counting only restrooms with genuine posted hours, 18% of residential land is within a five-minute walk of an open restroom at 3pm. At 9pm it is 2%.
Share of each neighbourhood within a five-minute walk of a restroom open at that hour, counting only restrooms with genuine posted hours. Interactive map.
On a weekday evening, only 57 restrooms are open at 9pm. The chart shows how far a rider leaving one of the 50 busiest subway stations must walk to reach a restroom that is open at that hour. Team research · Steph
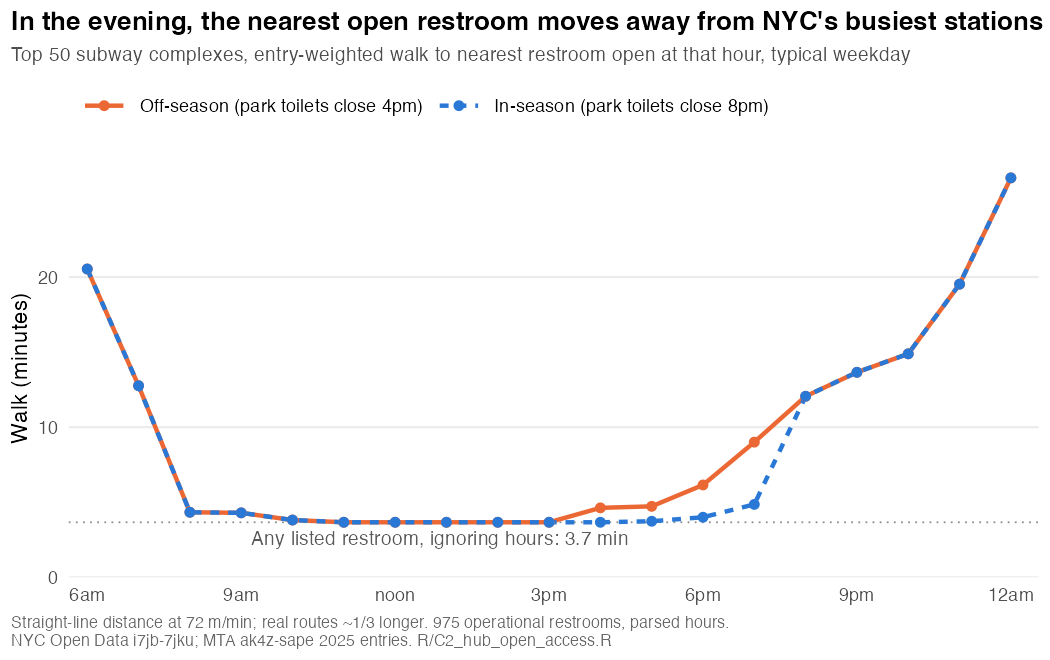
| Top 50 hubs, Wednesday | Average walk | Hubs with no open restroom within 500 m |
|---|---|---|
| 2pm | 3.7 min | 4 of 50 |
| 6pm, off-season: park restrooms close 4pm | 6.2 min | 21 of 50 |
| 6pm, in-season: park restrooms close 8pm | 4.0 min | 9 of 50 |
| 9pm, either season | 13.7 min | 43 of 50 |
| 9pm, if park restrooms stay open until 10pm | 5.9 min | 20 of 50 |
The true summer closing time is unknown. 641 of the 975 operational restrooms show the same placeholder hours, "8am-4pm, Open later seasonally". The main 9pm row assumes park restrooms close by 9pm.
"Open 24 hours" means a gas station. The register lists 8 facilities as open 24 hours. All 8 are parkway gas stations or a parkway snack bar. Team research · Steph
Among the six priority areas, the evening gap is worst in Astoria and smallest in Midtown. The table gives the median walk at 9pm from where complaints are filed to the nearest open restroom.
| High-confidence area | Walk at 9pm | Restrooms open at 9pm inside it |
|---|---|---|
| Astoria (East)–Woodside (North) | 47.6 min | 0 |
| Williamsbridge–Olinville | 36.6 min | 0 |
| Brighton Beach | 25.5 min | 0 |
| East Harlem (North) | 24.5 min | 0 |
| East Elmhurst | 23.1 min | 2 |
| Midtown–Times Square | 7.9 min | 6 |
Astoria's figure rests largely on the thin hot spot flagged in section 1, which holds 36 of its 59 complaints and none after 2022. Williamsbridge–Olinville, at 36.6 min, is the worst case whose complaints run through 2026.
Midtown is the best served of the six at 9pm, so a shortage of open restrooms does not explain its excess complaints. Nightlife or street homelessness may; the Limits tab keeps this open.
Complaints lean toward the evening and the night. 30% are filed between 6pm and midnight. Against 311 dirty-condition complaints, which reflect the same calling habits, urination complaints run 1.4–1.9× as high between 6pm and midnight and 1.4–2.3× between midnight and 5am.
That pattern fits closing times. It fits nightlife and alcohol just as well.
Why complaints concentrate here: access is the leading hypothesis. Outside evidence is mixed, and our data cannot confirm it, so it should be tested.
The outside evidence comes from San Francisco, not New York. There, 13 new staffed Pit Stop restrooms were followed by 12.47 fewer feces reports a week, p = 0.0002, but three Pit Stops given longer, 24-hour service saw 12.00 more a week, p = 0.0016, which the authors call unexpected (Amato et al., 2022). A 2025 follow-up covering 2009–2022 found that "the effect appears to be small" (PLOS ONE, 2025). Team research · Steph
In New York, the largest hot spots in Williamsbridge and East Elmhurst sit 47 m and 126 m from park restrooms that are locked at night.
Our data cannot confirm it citywide. Once crowds are counted, no measure of supply predicts complaints: not the number of restrooms, not the number open at 9pm, not the share in parks. Most park hours are placeholders, counts are thin, and restrooms tend to be built where problems already are, which can hide an effect.
The hours gap in the data is fixable. Paris publishes one open dataset of every public toilet with its status and opening hours.
Whether night closures drive complaints is untested, and cheap to test. Section 4 sets out a test at the two named park restrooms.
Caveat: complaint times are filing times, not the time of the incident.
3 — What first
Panel data, facility fixed effects, placebo test, delivery times, cost analysis
The existing stock is deteriorating. This is the strongest result here. NYC Parks inspectors grade every comfort station on a schedule: 31,768 inspections.
Comparing the same January–June window each year, the unacceptable share was flat for three years, then jumped in 2025–26.
| January–June | Rated unacceptable |
|---|---|
| 2022 | 9.4% |
| 2023 | 9.0% |
| 2024, the lowest year | 8.5% |
| 2025 | 11.3% |
| 2026 | 20.1% |
That is 9.4% → 20.1% since 2022, and 8.5% → 20.1% since 2024. The 2024 and 2026 figures rest on 743 and 693 rated inspections.
- It is the same buildings getting worse. With facility fixed effects, 2026 is +11.4 pp above 2024.
- It does not look like stricter marking. The 7 inspectors who rated restrooms in both years marked litter no worse, 0.016 → 0.011, while structural failures rose from 0.044 to 0.210.
- A field audit finds the same problem on the ground. The City Council's random "Good to Go?" audit, Aug–Sep 2025, found 36 of 337 rooms locked during posted hours, all in parks, and 129 of 301 open rooms missing a basic necessity. It is a single snapshot, so it confirms the level, not the trend. Team research · Steph, Candy
- 80 of 736 Parks comfort stations are under long-term closure, 46 of them for repairs.
Each option is priced per area, one facility each, like for like:
| Option | Cost | Source |
|---|---|---|
| Build a new restroom | $4.0M | Median of 68 NYC capital projects. DDC's 2026 contract works out at $3.86M per building Team research · Steph, Candy |
| Install a modular unit, Portland Loo | $1.2M | NYC Parks' $6M pilot for five Portland Loos |
| Reconstruct an existing one | $1.66M | Median of 108 projects |
| Keep one restroom open 4 hours longer | $51,100 a year | Assumes $35/h staffing |
The lowest-cost option in each of the 29 places adds up to $24.1M in capital plus $0.51M a year to run the longer hours:
| Lowest-cost option | Places |
|---|---|
| Modular unit | 9 |
| Reconstruction | 8 |
| Longer hours | 10 |
| Monitor | 2 |
An area is classed "close early" when the median posted day of its restrooms is under 9 hours, or none is open to 22:00. All 10 have at least one restroom with real posted hours, and 9 of 10 keep the class when placeholder-hours restrooms are left out.
Dividing each option's yearly cost by its area's excess complaints, the lowest ratio is longer hours in East Harlem (North), at $5,199 per excess complaint a year. Next is a modular unit in Astoria (East)–Woodside (North), at $14,727. This ranks cost against the size of the problem; it is not a measured effect.
Longer hours are the cheapest option to test, not a proven fix. They beat a modular unit only if they are at least 63% as effective as one. The median costed area, of 27, has 1.8 excess complaints a year, too few to measure an effect area by area.
Repair is a service-quality priority, not a proven way to cut complaints. The decay is citywide rather than concentrated where complaints are high: in the 29 priority areas, 15 of 72 inspected comfort stations were rated unacceptable in 2026, against 116 of 507 elsewhere. Long-term closures run slightly higher there, 14 of 100 against 66 of 636.
Repair now, and test longer hours alongside. The stock is measurably decaying, and a reconstruction costs well under half as much as a new permanent building. It also delivers sooner: a median 4.5 years from design to completion, against 7.4 years for a new building, on 70 and 38 completed projects, p < 0.001.
A closed restroom serves nobody, while a reopened one serves whoever is there.
Caveat: the hours cost is an assumption. Hours stay the lowest-cost option only while staffing costs less than about $100/h, under this one-facility-per-area convention.
4 — How to measure the pilot
Power analysis, service metrics, randomised staggered trial
An impact evaluation of the 17 pilot units would be underpowered. Only 20 complaints a year are filed within 400 m of all 17 sites combined, during the pilot's opening hours. A before-and-after comparison with matched areas could detect only a 73% drop in complaints, or 44% using urination summonses.
With 1 of 17 units in a high-confidence area, the pilot cannot test the ranking either.
Judge the pilot on service: the hours it is actually open, not the units installed. Team research · Steph, Candy
- Cost per verified open hour divides total cost by the hours each unit was found open and working. Against scheduled hours the pilot costs $42.98 per unit-hour: $4M ÷ 17 units × 15 hours × 365 days. The Council audit found 36 of 337 rooms locked during posted hours, so scheduled hours overstate service.
- Stage gates. Verify that a site is really underserved, confirm the unit is open and working, then scale up. Only after that should a site get a permanent building.
- Data to require from the operator, site by site and week by week: open and closed timestamps, uses, faults, time to repair, and cost. Washington DC's pilot law, D.C. Act 25-172, already requires monthly reports on use and misuse.
Test impact where it can be seen: longer evening hours. Start with the two park restrooms beside the largest hot spots, Gun Hill Playground in Williamsbridge and Gorman Playground in East Elmhurst, and compare them with matched restrooms. Then extend the same design to the 10 areas that close early.
| Hours trial | Detail |
|---|---|
| Scope | The two named playground restrooms first, then all 51 restrooms in the 10 areas that close early |
| Rollout | Random, staggered order over ten months |
| Cost | $2.2M for ten months; $2.6M a year |
| Smallest change it can detect across the 10 areas: complaints | 156%; complaints are too sparse |
| Smallest change it can detect across the 10 areas: public-urination summonses | 37% |
The trial opens every restroom in the 10 areas, not the one per area costed above, so it tests the strongest version of the option.
Caveat: summonses partly track policing, so they cannot rank places. Within one area over time they can measure change, unless longer hours also change patrols, which the alcohol-summons placebo, a count of alcohol summonses that longer hours should not change, is there to catch.
5 — What we recommend
| Who | Do this | Cost |
|---|---|---|
| Mayor's Office: LL58 strategy, due 1 Nov | Site the next units by the need ranking and the hot-spot table. 14 of 17 pilot units are outside every priority area. Of the six, only East Elmhurst and Brighton Beach stay in the top 25 on phone-filed complaints alone | $24.1M capital for the lowest-cost option in all 29, plus $0.51M a year for longer hours |
| NYC Parks | Clear the repair backlog as a service-quality priority: the stock is decaying citywide, and reconstruction delivers in 4.5 years against 7.4. Run the evening-hours test at Gun Hill and Gorman Playgrounds alongside | $2.2M for the ten-month hours trial |
| MTA and DOT | Midtown–Times Square: monitor. It is the best served of the six, so the cause of its excess complaints is unresolved. If a unit is sited there, place it at the station exits, where its complaints cluster | — |
| All agencies | Publish service data, meaning verified open hours, uptime and real closing times, so the pilot can be judged | — |
6 — How we know it holds up
- The model scores 0.784–0.791 across six random seeds. A decision tree scores 0.720.
- Adding 1,886 chain cafés and fast-food outlets as informal supply leaves the ranking unchanged, at 0.997.
- Each of the six high-confidence areas was re-scored with itself left out, and all held.
- The weak points: the ranking does not fully survive a phone-only check; the ratio may partly track street homelessness or nightlife; and no New York estimate yet shows that a restroom reduces the problem. The limits section below sets out each one.
Merged version: limits and open questions
This tab collects every weakness in one place, starting with the questions we have not yet answered.
Open questions: not yet resolved
These are the four hardest objections to the analysis. None has a full answer yet.
- The need ratio may partly map street homelessness or nightlife. The model adjusts for subway riders, jobs, hotels, residents, income, age mix and borough. It has no control for shelters, unsheltered counts, bars or late-night licences. Midtown–Times Square is the sharpest case: it is the best served of the six at 9pm, so its excess complaints need an explanation other than supply. A neighbourhood with many people living on the street, or a busy bar strip, could show a high ratio for reasons a new restroom would only partly fix. Next step: add DHS shelter counts by neighbourhood as a control and re-rank.
- The confidence figures and the phone-only check point in different directions. East Harlem (North) and Astoria (East)–Woodside (North) both have a posterior probability above 0.999. Yet if we re-rank using only complaints filed by phone, East Harlem falls to 41st, Astoria to 121st, Williamsbridge–Olinville to 50th, and Midtown–Times Square from 17th to 42nd: four of the six. The two results fit together once you see what the posterior assumes: it measures how sure we are given that complaints measure need. The phone-only check questions that assumption. The right reading is "very sure there are excess complaints here", which is weaker than "very sure there is excess need". Of the high-confidence areas checked, Brighton Beach and East Elmhurst hold under both.
- The trial outcome is the one we rejected for ranking. Across neighbourhoods, urination summonses correlate 0.95 with alcohol summonses, which means they map policing more than need. We therefore did not use them to rank places. In a before-and-after design each area is compared with itself, so constant enforcement cancels out. But if opening restrooms for longer changes patrol patterns, it does not cancel. The alcohol-summons placebo would catch a general shift in patrolling, though not one aimed specifically at restroom areas.
- Do night closures cause the complaints? Access is the leading explanation: outside evidence from San Francisco supports it, and the largest hot spots in Williamsbridge and East Elmhurst sit beside park restrooms locked at night. But no measure of supply predicts complaints once crowds are counted (§12). Next step: the evening-hours test at Gun Hill and Gorman Playgrounds, with matched controls.
1. The ranking orders places; it does not sort them into categories
Complaint counts are thin, so there are two things to check.
- Is the variation real? Yes. The spread across neighbourhoods is wider than chance alone would produce.
- Are the worst places a separate group? No. Suppose every neighbourhood genuinely differed by exactly the spread we estimated. Simulations of that city throw up 33.8 neighbourhoods above 1.5× on average; we found 29. Need shades continuously from the top of the list downwards, so the 1.5× threshold is a budget decision, not a discovery.
- How sure are we about one place? The posterior probabilities (Walkthrough, "Where") answer this. Six neighbourhoods clear 0.95; East Flatbush–Rugby just misses at 0.948. Each result held when the neighbourhood was left out of the model and the prior. A formal correction for testing all 197 places at once would clear none of them. So the honest claim is about where to look and where to spend first, not a proven fact about any single place.
2. We never validated the thing we actually deliver
The model predicts complaints well: 0.788 against the one-line rule's 0.703, scored on neighbourhoods it had not seen. But what we deliver is the gap between prediction and reality, and nothing can validate that gap, because "true unmet need" has never been measured. The better the model predicts, the less gap is left to rank. Excess-mortality estimates work the same way, but they rest on counts in the thousands; ours are in the tens.
3. We cannot yet show that a restroom reduces street urination in New York
We tried two causal designs. Both failed:
- Closures. The inspection records flagged as "closures" turned out mostly to log construction activity, not real closures, so there was nothing to measure.
- Winter closures. Seasonal restrooms shut every winter while year-round ones stay open, which looks like a natural experiment. Urination summonses near seasonal sites fell (IRR 0.624). But the placebo, alcohol summonses, fell almost as much (IRR 0.699). Parks empty out in winter, so we had measured the season, not the restroom.
So this project contains no New York effect estimate, and no return-on-investment figure. Published evidence does exist from elsewhere. In San Francisco, Amato et al. (BMC Public Health, 2022) found −12.47 feces reports a week after 13 new Pit Stop restrooms opened. A 2025 follow-up in PLOS ONE found "the effect appears to be small". What does not exist is a US cost-benefit study. Our break-even figures show how large an effect would have to be to justify the spend; they are not a measured effect.
4. The cost comparison depends on assumptions
- Every option is priced for one facility per area, like for like. On that basis the $24.1M capital figure has a running cost of $0.51M a year for the longer hours. The trial is costed separately because it opens all 51 restrooms in its 10 areas: $2.6M a year.
- The staffing cost ($35/h) and the extra hours per day (4) are assumptions, not sourced figures. Extending hours stops being the cheapest option at about $100/h.
- If every restroom in an area needed its own extra staffing, East Harlem (North) would fall from 1st to 9th in cost per excess complaint.
- Installing a unit in all 29 places would cost $34.8M (29 × the $1.2M Parks pilot price). Of course the cheapest-fix mix costs less than that; the comparison is true by construction and is not a finding.
- The modular price ($1.2M, from NYC Parks' Portland Loo pilot) is for a unit connected to water and sewer. The 2026 pilot's $235k per unit-year is a service contract (units plus cleaning), so the two figures are not comparable.
5. Complaints measure complainers
- Across community boards, complaint counts correlate 0.31 with the share of reports filed online.
- On phone-only reports, four of the six high-confidence areas drop sharply, Midtown–Times Square included (17th → 42nd; see the open questions above).
- The person who complains and the person who needed a toilet are different people. To some extent we are measuring annoyance.
- We tested police summonses as an alternative: they are 27,384 records and far denser. They correlate 0.95 with alcohol summonses, so they map enforcement. We kept complaints.
6. The parks explanation is inferred, not measured
824 of 1,066 restrooms are in parks, and capital money follows that existing stock: an area's existing restroom count is the strongest predictor of a restroom capital project, with an odds ratio of 4.72 per log-unit of restroom count. Measured need points the right way but is not significant in any version: 1.63, p = 0.075.
Once crowds are accounted for, supply shows no link with complaints, and the share of restrooms in parks does not predict them either (§12). Park-sited and street-sited restrooms were never compared directly, because there are too few street-sited ones to compare.
7. The trial is blunt
Measured on 311 complaints, the trial could only detect a change of 156%, or 433% using phone-filed reports alone. Measured on summonses, it can detect 37%. That is enough to catch a large effect but not a modest one, and the summons outcome carries the policing caveat in open question 3.
8. The deterioration finding is strong, but not airtight
- The within-inspector test rests on 7 people. Standard errors clustered on seven inspectors are unreliable.
- A gradual shift in inspector emphasis cannot be ruled out. The January–June rate was flat from 2022 to 2024 (9.4%, 9.0%, 8.5%) and then jumped (11.3%, 20.1%), which could fit a change in how inspectors rate as well as real decay. 2024, our comparison year, is the lowest of the five. New inspectors fail restrooms less often, not more. We found no published change to the inspection method, but that does not prove there was none.
- Park-wide condition makes a poor placebo. Parks without a comfort station improved while parks with one got worse, so the citywide average hides two opposite movements. Site condition also moves with restroom condition. We rely instead on the internal placebo: the same inspector on the same visit marked litter as flat while structural failures rose.
- 2026 is a part year. Every year is compared on the same January–June window.
- It measures condition, not siting. The siting question still rests on complaints.
- Component-repair costs are too thin to quote. Only 5 projects in the capital tracker are component work.
9. Data problems worth knowing
- Placeholder hours. 525 of the 843 year-round restrooms have the same text: "8am-4pm, Open later seasonally". The City's own register cannot say what is open at 9pm.
- A stale register. Its rows were last updated on 27 June 2025. The City Council's dashboard says 973 are operational; the register gives 975, and we use the register. The dashboard's "49.42% within a five-minute walk" has no published method, so we do not use it.
- The capital tracker repeats rows. Its entries cover 191 restroom projects, and bundled entries repeat costs. Many projects give only a cost band, and those are the expensive ones, which is why the pooled median is $2,331,000.
- Retired 311 complaint types return zero rows without any warning.
10. Datasets that looked useful and were not
| Dataset | Why we dropped it |
|---|---|
| Police summonses | Map enforcement, not need (0.95 with alcohol summonses) |
| Cultural organisations | A grants roster: a small theatre collective and the Met each count as one row |
| Pedestrian counts | Only 114 counting points for the whole city |
| Chain cafés and fast-food outlets (1,886) | No effect on the ranking (0.997 agreement) |
| A hand-weighted station index | Tested against where complaints fall, it ranks stations worse than ridership alone (§11) |
11. A station-level screen did not beat ridership
A screen of 424 subway station complexes scores each station on its ridership, its walk to the nearest listed restroom and whether any restroom is within 500 m. Tested against where complaints actually fall, it ranks stations worse than ridership alone: 0.467 against 0.624 out of sample, worse in 100% of 200 splits.
The restroom-distance part adds nothing once ridership is known. Each doubling of the distance changes complaints by a factor of 0.94 [0.86–1.03], which is indistinguishable from none.
The station list remains a useful inventory of busy places, and the hub figures in the Walkthrough describe access. Locating hot spots is done with the complaint map.
12. The supply-mechanism tests came back null
Evening supply was added to the ranking model to test whether restrooms in the wrong places, or closed at the wrong hours, explain complaints. None of the measures carries a signal once crowds are counted:
| Measure added | Effect on complaints, 95% CI |
|---|---|
| Restrooms open at 9pm in the area | 1.22 [0.91–1.63] |
| Share of restrooms in parks | 0.87 [0.51–1.46] |
| 9pm walk coverage, per 10 points | 1.07 [0.98–1.17] |
The best of these improves out-of-sample accuracy by +0.004. Areas where coverage collapses most after dark do not have a more evening-weighted complaint mix either: odds ratio 1.00 [0.92–1.09].
Three reasons stop this from showing that restrooms do not matter:
- The hours data is mostly placeholder. 641 of the 975 operational restrooms show the same generic hours, so evening supply is measured with error.
- The counts are thin. Only 57 restrooms are open at 9pm on a weekday, so there is little variation to test.
- Placement may run in reverse. Restrooms tend to be built where people and problems already are, which pushes any cross-sectional estimate toward "more supply, more complaints".
13. The pilot's impact cannot be read from complaints
Only 20 complaints a year are filed within 400 m of all 17 pilot sites combined, during the pilot's opening hours. A matched before-and-after comparison could detect only large drops:
| Outcome within 400 m of the 17 sites | Smallest detectable drop |
|---|---|
| 311 complaints filed 7am–10pm | 73% |
| Urination summonses | 44% |
| Urination summonses, net of the alcohol-summons placebo | 40% |
All three are weaker than the hours trial's 37%. That is why the Walkthrough judges the pilot on service and puts the impact test in the hours trial.
14. The peer-city comparison is approximate
- Each city's list covers different things. New York's register is mostly park comfort stations, Paris's list is mostly street kiosks, Hong Kong's leaves out park toilets and San Francisco's leaves out some street toilets. Every record was sorted into one rule by hand, so treat the table as three groups, not a precise league table.
- New York's 9.0 counts park, plaza and transit restrooms only. Counting every facility on the register, libraries included, gives a higher figure that is not comparable with the other cities.
- The exact rank is not robust. New York is 8 of 8 on the core rule, but Toronto, Berlin and Hong Kong's list are within 2–12% of it. The gap with Paris, Zurich and San Francisco holds under every variant tested.
- Populations come from each city's own statistics office, so years and boundaries differ slightly.
Every dataset and script is listed in the Data & code tab.
Archived version of 22 Sep 2026, kept for comparison. Some figures are superseded — current figures are in the Walkthrough.
Walkthrough (22 Sep)
The whole project, step by step, with the arithmetic shown at each stage.
The answer, up front: twenty-nine neighbourhoods need attention. Nine need a building, ten need only to stay open four hours later, and the rest need repairs to what is already there. Before committing the capital, spend $1.9M finding out whether any of it works.
The situation
- New York has 975 operational public toilets, of 1,066 on the city's register. (The City Council's dashboard says 973; we use the register we can audit.)
- A 2025 law — Local Law 58 — sets a target of 2,120 by 2035 and requires the city to publish a plan for getting there.
- 2,120 − 975 = 1,145 more facilities implied.
- The city has no published method for deciding where they go.
- Last time it tried: 20 automatic toilets bought, 5 installed, 15 left in a Queens warehouse for over a decade. The units were paid for; the city could not settle where to put them.
- For scale: a median toilet project costs $2,331,000 to build.
Our question: where should the next ones go?
Four bodies would act on the answer, and each controls a different decision:
| Who | What they decide |
|---|---|
| Mayor's Office of Operations | Owns the strategy the law requires |
| NYC Parks | What to reopen, repair or keep open longer |
| DOT Public Realm | Where to site units in plazas and on sidewalks |
| MTA (the subway and bus operator) | Which station complexes have weak access nearby |
The measurement problem
- Nobody records "person needed a toilet, could not find one."
- New Yorkers report street problems by calling 311, the city's non-emergency service line. Every call is logged with a date, a location and a category, and the records are public.
- The closest observable thing to our problem is therefore the category "Urinating in Public" — roughly eight thousand calls over six years.
- So that becomes the signal — imperfect, but real, dated and mapped.
Step 1 — Clean the signal
Descriptive statistics, data quality
Raw complaint records, filtered down:
| Step | Records |
|---|---|
| All "Urinating in Public" complaints, 2020–2026 | 7,926 |
| Keep only public places (drop complaints inside residential buildings) | 4,706 |
| Keep only those with usable coordinates | 4,584 |
| Collapse repeats: one count per address per month | 3,629 |
Why that last step matters:
- The top 1% of addresses produce 22.3% of all complaints.
- East Harlem ranked worst in the city — but 223 of its 384 complaints came from five adjacent addresses on one street.
- Those five addresses are one block, reported repeatedly by the same handful of people. The count describes a dispute on one street, not a shortage across a neighbourhood.
- After collapsing repeats, the worst areas become Midtown, the Upper West Side, Chelsea, the Village, Elmhurst, Jackson Heights. Busy, plausible.
Finding 1: the raw data points at the wrong places. A handful of addresses dominate it, so any ranking built on uncleaned counts sends the city's money to whichever streets have the most persistent callers. Skipping this step changes the answer completely.
Step 2 — Account for crowds
Multiple regression (negative binomial), dummy variables
- Complaint counts rise with the number of people present, so a raw count mostly measures footfall.
- To separate the two, we estimate how many complaints a place would be expected to produce given how many people are there.
What goes into the estimate:
| Input | Why it matters | Source |
|---|---|---|
| Subway riders | Largest source of people away from home | MTA, 426 station complexes |
| Jobs in the area | People at work cannot use their own bathroom | US Census LEHD, 4.59M jobs |
| Hotels | Visitors | NYC tax records, 1,225 buildings |
| Residents, income, age | Who lives there | US Census ACS |
| Existing toilets nearby | Supply already in place | NYC Open Data, 1,066 facilities |
Everything is public data. The full list, the pull dates and the code are linked at the foot of this page.
- Method: a negative binomial regression — a standard model for counting things that cluster unevenly.
What the model learned. Fitting it to the whole city gives the size and direction of each effect:
| Input | Effect on expected complaints |
|---|---|
| Subway riders | Up — the strongest effect, and it held up in every test |
| Jobs in the area | Up |
| Hotel rooms | Up, but it did not hold up once the rest was accounted for |
| Toilets already nearby | No measurable effect |
The first three are unsurprising: more people present, more complaints. The last one is not, and it becomes step 6.
- Output: for every neighbourhood, an expected number of complaints — the number a place that busy would normally produce.
Step 3 — Find the places that break the pattern
Residual analysis
The calculation, for each of 197 neighbourhoods:
observed complaints ÷ expected complaints = the unmet-need ratio
Above 1.0 means more complaints than predicted, below means fewer. This is the measure used for the rest of the analysis.
Top of the list — read the first row as: Brighton Beach recorded 24 complaints where the model expected 6.3, which is 3.8 times as many.
| Neighbourhood | Observed | Expected | Ratio |
|---|---|---|---|
| Brighton Beach | 24 | 6.2 | 3.9× |
| East Elmhurst | 36 | 10.3 | 3.5× |
| East Flatbush–Rugby | 18 | 5.8 | 3.1× |
| East Harlem (North) | 99 | 33.0 | 3.0× |
| Williamsbridge–Olinville | 39 | 13.1 | 3.0× |
| Astoria (East)–Woodside (North) | 57 | 20.2 | 2.8× |
Finding 2: the answer is not the obvious one. Ranking by raw complaints points at Midtown — already the best-served part of the city. Ranking by unexplained complaints points at ordinary outer-borough neighbourhoods.
Step 4 — Check the model is worth having
Train/test validation, benchmark comparison, decision tree
Before trusting the model, we check it against a deliberately crude alternative.
- The test: each rule predicts how many complaints a neighbourhood should have. Rank the 197 by that prediction, rank them by the complaints they actually recorded, and measure how closely the two orders agree. The measure runs from −1 to 1; 0 means no relationship, 1 a perfect match, and around 0.7 is strong agreement.
- The crude rule: rank neighbourhoods by subway ridership alone, one line of code.
- A more targeted version: count ridership only at stations with no toilet within 400m. The thinking is that crowds who already have a toilet nearby are served, so unmet demand should sit at the stations without one.
- Head to head on the same data, plain ridership scores 0.713 and the targeted version 0.487.
- Narrowing it made the prediction worse, and the reason is informative: a huge station with a toilet beside it still has huge crowds and still generates complaints. Filtering those stations out threw away real demand. Proximity to an existing toilet turned out not to matter much — an early hint of something step 6 finds directly.
- The full model, tested on neighbourhoods it had never seen, scores 0.788 against the crude rule's 0.703 on the same test.
- Those two figures come from hiding 30% of neighbourhoods, training on the other 70%, and scoring the predictions against the hidden ones — repeated 200 times with different random selections. The model won 189 of them.
Finding 3: the model beats a one-line rule — 0.788 against 0.703, winning 96% of 200 trials.
Step 5 — The answer
Spatial analysis and mapping
Run the validated model across all 197 neighbourhoods and this is the output: a map of unmet need, coloured most strongly where complaints most exceed what the area's crowds explain.
Each neighbourhood is shaded by how many complaints it had against how many the model expected for a place that busy. Grey means the two match. Shaded areas had more complaints than their crowds account for — which is why a busy district with a high complaint count can still read grey, while a quiet one with far fewer can be the darkest on the map.
- The map is labelled by borough, with Times Square marked for orientation — Manhattan is the narrow island at the centre.
- Grey covers 150 of the 197 neighbourhoods — those within 25% of what their crowds predict. The 47 coloured ones are more than 25% above it. (78 exceed prediction at all; the map shades only the clearer cases.)
- Of those, 29 sit at 1.5× or above — half again as many complaints as predicted. That threshold is the working shortlist for everything that follows; the eight most strongly coloured areas on the map are its top end.
- The 1.5× line is a budget decision, not a natural boundary. Need shades continuously; nothing in the data marks where "normal" ends. Draw the line elsewhere and the shortlist grows or shrinks smoothly.
- The remaining steps take up a different question: why these places, and what would fix them.
Step 6 — Why the gap exists: the toilets are in the wrong places
Logistic regression
Each map highlights the top thirty by each measure — the supply map shows a few more, because many areas tie. On the left, those with the most complaints beyond what their crowds explain; on the right, those with the most public restrooms. Only five neighbourhoods appear on both.
- 824 of the city's 1,066 catalogued public toilets sit inside parks. (973 of the 1,066 are currently operational; the rest are closed or seasonal.)
- Complaints cluster on streets — transit, commercial strips, nightlife.
- We modelled which neighbourhoods receive toilet construction money. Parkland predicts it clearly. Measured need does not come through at all clearly — its effect could be substantial or could be nothing, the data cannot separate the two.
- And once you account for how busy a place is, how many toilets an area has tells you nothing about its complaint count (rate ratio 1.001, where 1.000 means no relationship at all).
- Toilets get built where problems already are, so a snapshot cannot separate cause from effect. What it does show is that the current stock is not visibly reducing the problem anywhere — which sent us looking at where the toilets are, and when they are open.
- Midtown has the highest complaint count in Manhattan and has never received a Parks toilet project — because Midtown has almost no parkland.
Finding 4: the funding route favours parkland. Restroom money moves through Parks capital projects, and it lands where parkland is. Midtown–Times Square is among the highest-complaint areas in the city and has never received one; it has almost no parkland. Three pieces of evidence point this way, but we never compared park-sited against street-sited facilities directly — see the second tab.
Step 7 — Why the gap exists: they close too early
Spatial coverage analysis, time-of-day comparison
Share of each neighbourhood lying within a five-minute walk of a restroom that is open at that hour, counting only the 316 facilities whose opening times are genuinely recorded. Across the city the covered area falls from 24% at 3pm to 3.5% at 9pm, and 154 of 197 neighbourhoods retain almost none.
| Time of day | Share of complaints | Share of toilets open |
|---|---|---|
| Midnight–6am | 6% | under 3% |
| 6am–noon | 27% | rising to ~80% |
| Noon–6pm | 37% | ~86% |
| 6pm–midnight | 30% | 45% at 6pm, 7% by 11pm |
- Peak complaint hour: 6pm. That is the hour availability collapses.
- Only 8 facilities citywide are open 24 hours.
Is the 6pm peak real, or just when people are free to phone? 311 records when someone called, not when the incident happened, so we checked it against a different complaint type filed by the same public through the same channel.
| Complaint type | Peak hour | Share filed 6pm–midnight |
|---|---|---|
| Public urination | 18:00 | 30.7% |
| Dirty-condition complaints | 08:00 | 18.3% |
If the evening peak were simply calling habits, both would peak together. They do not, and urination complaints are 1.7 times more evening-weighted. Some shared daily rhythm exists, but the peak itself is real.
Finding 5: supply disappears exactly when demand peaks.
Step 8 — And the ones that exist are falling apart
Panel data, fixed effects, placebo test
Steps 6 and 7 explain the gap through where restrooms are and when they open. There is a third reason, and it comes from a different dataset with none of the weaknesses of the first seven steps.
NYC Parks sends trained inspectors on a schedule to grade every comfort station — the American term for a standalone public toilet building in a park — litter, graffiti, amenities, and structural condition. That is 31,768 inspections, against 3,629 complaints. An inspector who turns up on a rota, not a resident who chooses to call.
| Share of inspections rating the restroom unacceptable | |
|---|---|
| 2022 | 9.4% |
| 2023 | 9.0% |
| 2024 | 8.5% |
| 2025 | 11.3% |
| 2026 | 20.1% |
Failures more than doubled in two years. Counting the facilities that could not be rated at all — locked, closed, mid-renovation — only 56.8% of 2026 inspections found an open, acceptable restroom, against 71.3% in 2024.
Three things could explain that without any building changing. We tested all three.
Is it a different set of buildings? No. With facility fixed effects — comparing each comfort station against its own history — 2026 still sits +11.4 percentage points above 2024 (SE 2.0pp, p < 0.0000001). The same buildings got worse.
Is it harsher inspectors? No. The same inspector, on the same visit, fills in four scores. Taking only the seven inspectors who rated restrooms in both years, so the grader is held fixed:
| 2024 | 2026 | |
|---|---|---|
| Litter | .016 | .011 |
| Graffiti | .002 | .006 |
| Amenities | .096 | .114 |
| Structural | .044 | .210 |
A grader who got stricter would mark litter harder too. Litter went down, while structural nearly quintupled. Only the fabric of the buildings did — plumbing, fixtures, partitions.
Is it a rule change? No. A revision to the rating guidance produces a step at one date. This is a steady climb across ten quarters:
2024: .052 · .060 · .103 · .084 → 2025: .146 · .120 · .135 · .169 → 2026: .173 · .190
New inspectors also fail restrooms less often than returning ones (.090 against .210), so the rise is not new staff applying new standards.
Finding 6: the existing stock is deteriorating, and it is structural decay rather than cleaning. This is the only finding in the project measured by a trained observer rather than inferred from complaints.
Why it matters for the decision. Local Law 58 — the 2025 law above — commits New York to planning around 1,150 new restrooms. It does not fund repair. Meanwhile 80 of 736 Parks comfort stations are already under long-term closure — 46 of them for repairs — and across the wider inventory 91 of 1,066 are not operational.
The capital record prices the two paths very differently:
| Median cost | Projects | |
|---|---|---|
| Build a new restroom | $4,000,000 | 68 |
| Reconstruct an existing one | $1,656,500 | 108 |
One new build buys roughly two and a half rebuilds of restrooms the city already owns. The city is preparing to double a stock it is not maintaining.
Step 9 — Work out the cheapest fix for each place
Cost analysis, sensitivity testing
We now have 29 neighbourhoods that need attention. Each needs something different, and the first job is to work out what.
Ask what is actually wrong, place by place. The answer rules options in and out.
- New Dorp–Midland Beach — two toilets, and only 19% of the area within a five-minute walk of one. Most of the neighbourhood cannot reach a facility at all, so opening the existing two for longer changes little. The provision is not there.
- East Harlem (North) — seven toilets, good coverage, and still three times the expected complaints. People can reach a toilet. An eighth building is unlikely to be the missing piece, so the problem lies with the seven that exist: their condition or their hours.
Where more than one fix would work, cost decides.
Take a place with toilets in reasonable condition that close at 5pm. Two things would genuinely help — build another one, or keep the existing ones open longer:
| Option | Capital cost |
|---|---|
| Extend opening hours | $0 |
| Reconstruct an existing facility | $1,656,500 |
| Install a modular unit | $1,200,000 |
| Build a traditional comfort station | $2,331,000 (median of NYC's own projects) |
Both fix the problem. One is free. So the rule is: take the cheapest option each place's condition allows.
Applied across the 29:
| What is wrong | What it needs | Places |
|---|---|---|
| No toilet, or coverage under 35% | Build | 9 |
| Toilets exist but rated unacceptable | Repair | 8 |
| Toilets exist and are sound, but close early | Extend hours | 10 |
| Nothing identifiable | Monitor | 2 |
Finding 7: ten of the 29 need nothing built. Their toilets exist, work, and simply close before the hour complaints peak.
What that ordering is worth:
| Approach | Capital |
|---|---|
| Install a unit in all 29 | $34.8M |
| Cheapest fix each place allows | $24.1M |
The gap is not really the finding — the cheapest option costing less than the most expensive one is what the words mean. The finding underneath it is that ten of the 29 places already have working toilets that simply close too early.
The thresholds — 35% coverage, "unacceptable" condition — are judgement calls, and the mix of interventions is sensitive to them. We have not run a full sensitivity grid over the thresholds; that is an open item, not a result.
We also tried to prove toilets work. Twice.
Difference-in-differences, natural experiment, placebo test
Both attempts failed, and the second failed in a way worth showing.
Attempt 1 — find toilets that closed, check whether nearby complaints rose. The records turned out to log construction activity, not closures: only 151 of 2,057 flagged entries actually read "Closed". Unusable.
Attempt 2 — about 132 toilets shut every winter and reopen in spring, while 843 stay open year-round. A natural before-and-after with a built-in comparison group.
- It produced a clean result: closure associated with 38% fewer nearby incidents.
- A placebo test, fixed in advance: alcohol summonses have nothing to do with toilets, so they should not move.
- They moved almost as much: 0.699 against the real outcome's 0.624.
- The reason: seasonal toilets sit in parks, and parks empty in winter. Every kind of street offence falls together. We had measured the season, not the toilet.
Finding 8: we publish no effect estimate. A design that fails its own placebo gives no evidence in either direction.
What we recommend
Randomised staggered trial design, power analysis
So: not a construction programme. An experiment — because the number nobody has is the one the city most needs.
- Take the 10 neighbourhoods whose toilets exist and work but close early.
- Extend closing time by four hours, staggered in random order over ten months, so every area is treated eventually and the timing differences do the measuring.
- Those ten contain 44 facilities. At four extra staffed hours a day, about $2.2M a year, or $1.9M for a ten-month trial. No capital spend.
- Run by NYC Parks, which already operates them.
What it could detect:
| Outcome measured | Events in the window | Smallest change detectable |
|---|---|---|
| 311 complaints, phone-filed only | ~11 | 433% |
| 311 complaints, all channels | ~35 | 156% |
| Public-urination summonses (police-issued fines) | ~310 | 37% |
Complaints are far too sparse to run a trial on — a trial using them could only detect an effect four to five times larger than anything plausible. The trial should measure summonses instead.
That is consistent with what we found earlier: summonses track policing rather than need, which disqualifies them for ranking places, but a before-and-after design compares a place with itself, so a constant level of enforcement cancels out. The alcohol-summons series is available as the same placebo that caught us before.
37% is blunt: it catches a large effect and misses a modest one. It is still the only measurement anyone has attempted, and it costs $1.9M against $34.8M of building.
Alongside it, the one action that needs no experiment. Step 8 found the existing stock deteriorating — 80 comfort stations already under long-term closure, 46 of them for repairs. Restoring a restroom the city already owns costs a median $1.66M against $4.0M to build a new one, and unlike the hours trial it does not depend on an effect nobody has measured: a closed restroom serves nobody, and a reopened one serves whoever is there. Fix before building.
Then spend the capital on new sites, informed by a measured effect rather than an assumed one.
How we know the ranking holds up
Bootstrap resampling, spatial autocorrelation, sensitivity analysis
Five checks:
| Check | Result |
|---|---|
| Different random seeds | Score holds 0.784–0.791 across six |
| Informal supply (1,886 Starbucks, McDonald's etc.) | No effect on the ranking (0.997 agreement) |
| Measuring crowds a different way | Same names appear (0.92–0.997) |
| Spatial clustering — is it one area counted six times? | No clustering (Moran's I 0.107, p = 0.21) |
| A machine-learning model instead | Decision tree scores 0.720 against our 0.788 |
The one check it does not fully survive is reporting bias — see Complaints measure complainers in the Limits tab.
And one question the table does not answer: how sure are we about a single neighbourhood?
The five checks ask whether the ranking holds together. A budget-holder asks something narrower: is this place really short of restrooms? The model answers it directly — thin counts get pulled towards the citywide pattern, and what survives that pull is what we can be confident about.
| Neighbourhood | Borough | Observed | Expected | P(true rate > 1.5× expected) |
|---|---|---|---|---|
| East Harlem (North) | Manhattan | 99 | 33.0 | >0.999 |
| Astoria (East)–Woodside (North) | Queens | 57 | 20.2 | >0.999 |
| East Elmhurst | Queens | 36 | 10.3 | >0.999 |
| Williamsbridge–Olinville | Bronx | 39 | 13.1 | 0.999 |
| Brighton Beach | Brooklyn | 24 | 6.2 | 0.997 |
| Midtown–Times Square | Manhattan | 84 | 43.6 | 0.967 |
| East Flatbush–Rugby | Brooklyn | 18 | 5.8 | 0.948 — just short |
Finding 9: six neighbourhoods are individually above 95% confidence, with a seventh a whisker below. Each was re-scored with the model and the prior rebuilt from the other 196, so it could not vouch for itself. All held.
This fixes the thin-counts problem and nothing else — it does not touch what the complaints measure.
What this cannot do
Every limitation, with the arithmetic, is in Limits — the second tab. The three that matter most: the ranking orders places but does not sort them into categories; complaints measure complainers; and the gap between prediction and reality is the one quantity nobody can validate, here or anywhere.
Data and code
Everything behind this analysis is public and can be run: 57 R scripts, every dataset exactly as pulled, and the models that failed alongside the ones that worked.
Run it yourself
git clone https://github.com/JonathanWong1990/nyc-restroom-gap
cd nyc-restroom-gap/analysis
Rscript R/11_benchmark.R
Rscript R/Z0_headline_numbers.R   # rebuilds every number quoted on this site
You need R 4.6.1 and these packages: sf, dplyr, MASS, tidyr, data.table, sandwich, lmtest, rpart, leaflet, htmlwidgets, httr, jsonlite. The scripts read data_raw/ relative to the working directory; to run them from anywhere else, set RESTROOM_PROJ to the analysis/ folder. You do not need API keys or any downloads.
Where the numbers come from
Every figure on this site is taken from analysis/outputs/headline_numbers.json. R/Z0_headline_numbers.R writes that file by reading the raw data or running the script that owns each number. R/Z1_check_site.R then checks that this page, llms.txt and the README quote those values and none of the known-wrong ones. Outside facts (laws, press releases, studies) sit in the file's external block, each with its URL.
If you are handing this to an AI
llms.txt: this page as plain text, generated from this HTML.analysis/outputs/headline_numbers.json: every number, with the script it came from.METHODS.md: what each script does.analysis/notes/: one file per workstream, with external citations and access dates.
The layered analysis
The current walkthrough rests on these, in analysis/layered/ and analysis/build_plan/:
| File | What it does |
|---|---|
build_plan/R/01_prep.R | Demand points (residents, jobs, subway riders, busy streets), restroom supply open by hour, candidate sites |
build_plan/R/02_greedy.R | Coverage at 2pm and 9pm; maximal-covering site selection; hours-vs-build and pilot comparisons |
layered/R/01_layers.R | The four layers for all 197 neighbourhoods; build sites inside Build areas |
layered/R/03_final_rule.R | The action rule and its sensitivity table |
layered/outputs/diagnosis_29_final.csv | Every layer value and the action for each of the 29 |
build_plan/research_methods_precedent.md | Published precedent for coverage-based siting |
The inspection-prediction study and its independent checks are in analysis/pivot/.
The scripts
| Script | What it does |
|---|---|
11_benchmark.R | The one-line rule any model must beat. Start here |
10_modelling_table.R | Builds the 197-neighbourhood table |
20_regression.R | The ranking model (negative binomial, population offset, clustered errors) |
50_tree_vs_regression.R | Model vs benchmark vs decision tree on the same 200 splits |
A6_empirical_bayes.R | Per-neighbourhood confidence, with leave-one-out |
C2_hub_open_access.R | Walk from the busiest subway hubs to the nearest open restroom, hour by hour |
B1_small_maps.R, 70_audit_checks.R, C2_report_time.R | Coverage at 3pm vs 9pm; complaint timing; phone-only check |
A8_condition_trend.R | The deterioration finding: fixed effects plus the within-inspector placebo |
A7_repair_vs_build.R, 60_cost_layer.R, 61_cost_annualised.R | Build vs reconstruct; the lowest-cost option for each place; annual cost and the wage sensitivity |
P1_pilot_sites.R | Places the 17 pilot sites in neighbourhoods: 3 of 17 fall in the 29. Output outputs/pilot_sites.json |
C3_station_bridge.R, C5_hotspot_table.R | Tests the station screen against ridership; finds each area's complaint hot spots. Outputs outputs/station_bridge.json, outputs/hotspot_table.csv |
C4_area_evening_access.R | Walk at 9pm from where complaints are filed, area by area. Output outputs/area_evening_access.json |
T1_mechanism_tests.R, T1_F_pilot_power.R | Supply-mechanism tests, complaint timing, cost break-evens, delivery times, capital allocation, and the pilot's power. Output outputs/t1_tests.json |
C6_decay_in_priority_areas.R | Whether the decaying and closed stock sits in the 29 priority areas. Output outputs/decay_in_priority_areas.json |
E1_peer_city_per_capita.R | Public toilets per 100,000 residents in eight cities, one counting rule. Output outputs/peer_city_per_capita.json |
C1_trial_power.R | What the hours trial could detect |
40_logistic.R | Where NYC actually invests: existing stock, parkland and need |
A1_noise_floor.R, A3_seed_stability.R, 96_commercial_supply.R, A4_reporting_channel.R | Robustness checks |
93_winterization.R, 12–15_did_*.R, 90–92_*.R | Failed, kept on purpose: two causal designs and the rejected summons outcome |
Z0_headline_numbers.R, Z1_check_site.R | The numbers file and the site checker |
The full script-by-script list is in METHODS.md.
Every dataset we used
The NYC datasets were pulled on 20 September 2026; the pilot site list and the peer-city lists on 23–24 September. Row counts are what came out of the source; the figures used in the analysis are lower after cleaning.
| Dataset | ID | Rows | Used for |
|---|---|---|---|
| Public restrooms | i7jb-7jku | 1,066 | Supply: location, type, hours |
| 311 urination / public toilet | erm2-nwe9 | 8,193 | The outcome |
| 311 dirty conditions | erm2-nwe9 | 108,775 | Control for the report-time test |
| OATH summonses: urination | hxbk-grd3 | 27,384 | Rejected for ranking; the trial's outcome |
| OATH summonses: alcohol | hxbk-grd3 | 163,329 | The placebo |
| ACS 5-year 2024, tracts | US Census | 2,327 | Residents, income, age |
| LEHD LODES8 WAC 2023 | US Census | 25,445 | Workers |
| Taxi and for-hire trips by zone-month | c5iv-bn4s | 138,706 | Floating demand |
| Subway ridership, monthly | ak4z-sape | 48,255 | Transit exposure; hub ranking |
| Subway stations | 39hk-dx4f | 496 | Station locations |
| Hotels | tjus-cn27 | 14,010 | Visitors |
| Parks properties | enfh-gkve | 2,061 | Parkland |
| Parks capital tracker | 4hcv-tc5r | 2,787 | Build and reconstruct costs; delivery time |
| PIP inspections (master) | yg3y-7juh | 152,484 | Condition trend |
| PIP restrooms (closure flags) | 9byw-znpj | 736 | Long-term closures |
| PIP all sites | buk3-3qpr | 6,406 | Inspection site register |
| Park structures | n8q6-i44s | 2,857 | Cross-check on the inventory |
| Comfort-station COVID closures | i5n2-q8ck | 672 | Closure history (not a usable experiment) |
| Taxi zones | 8meu-9t5y | 263 | Joining taxi trips to geography |
| NTA 2020 · tracts 2020 · community districts | 9nt8-h7nd · 63ge-mke6 · 5crt-au7u | — | Units of analysis and clustering |
| Cultural organisations (not used) | u35m-9t32 | 2,535 | Not used in the current analysis |
| Pedestrian counts (not used) | cqsj-cfgu | 114 | Not used in the current analysis |
| Chain food outlets (robustness only) | 43nn-pn8j | 1,886 | Not used in the current analysis |
| Pilot site list | Mayor's Office, 16 Sep 2026 | 17 | Where the pilot units are |
| DOT pedestrian plazas · street centreline | k5k6-6jex · inkn-q76z | — | Locating the pilot sites |
| Official public-toilet lists: Paris, Zurich, San Francisco, Vancouver, Hong Kong, Toronto, Berlin | Paris · Zurich · San Francisco · Vancouver · Hong Kong · Toronto · Berlin | — | Peer-city comparison |
Files are in analysis/data_raw/, named <source>_<id>_<date>.csv. The outcome is 311 public-urination complaints from 2020 to September 2026, de-duplicated to one per address per month: 3,629 citywide, of which 3,556 fall inside the 197 residential neighbourhoods we model.
Contributions
The analysis draws on the whole team's research. Each contribution below was checked against its primary source.
| Contributor | Contribution | What it made possible |
|---|---|---|
| Steph | Screen of distance from 424 subway stations to the nearest restroom | The station figures and the "missing" layer (Walkthrough sections 3–4) |
| Giorgia | A 500 m service standard, and ranking areas to allocate restrooms | The coverage definition and the one-action-per-area design (sections 3 and 6) |
| Steph, Giorgia | The 17-unit pilot and its site list (NYC Mayor's Office, Sep 2026) | The pilot comparison (sections 1 and 7) |
| Steph, Candy | City Council "Good to Go?" audit (NYC Council, Dec 2025); service measurement by verified open hours | Independent evidence of locked restrooms (section 5); how to judge the pilot (section 8) |
| Steph | Source review identifying DOT's modelled pedestrian demand (fwpa-qxaf) | The busy-street figures (section 4) |
| Shawn | A like-for-like comparison with other cities' public toilets per resident | The peer-city table in the Merged archive |